


Ask a room full of YouTubers what a view is worth, and you will hear numbers pulled from a hundred different blog posts, most of them guesses. So instead of guessing, we pulled the real YouTube Analytics of 300 channels that AIR Media-Tech works with, every monetized month from May 2025 to May 2026, and measured what a view is worth. Across those 300 channels, the median RPM came out to about $2.30 per 1,000 views – roughly $2,300 for every million, after YouTube takes its 45% cut.
That number tends to surprise people, because it sits so far below the CPM figures quoted online. The bigger surprise is how little your niche has to do with it. Inside a single niche, the best-paid channels out-earn the worst-paid by three to eight times. The niche sets the floor. How you run the channel decides where you land above it.
This study is different from the RPM charts you have seen before in one way that matters. Instead of recycling advertiser-facing CPM estimates – the inflated, pre-cut number – we read the revenue line of 300 real Studio dashboards: 3,595 channel-months of verified RPM, CPM, ad load, and view data.
Here is what it says about what a view really pays in 2026, why your dashboard comes in lower than the numbers online, and the handful of levers that move your RPM more than your topic ever will.
About This Study
The figures here come from the real YouTube Analytics of 300 channels that AIR Media-Tech works with, covering every monetized month between May 2025 and May 2026: 3,595 channel-months in total.
We used verified RPM, CPM, ad-load, monetized-playback, and view data straight from Studio, not advertiser estimates or third-party guesses. The sample spans channels from 10,000 to 50 million subscribers across 13 niches.
All headline figures are medians, so individual viral channels cannot distort them. Four niches (Transport, News & Politics, Food & Cooking, Business & Finance) had fewer than ten channels and are marked as directional throughout.
We also ran a separate breakdown of what each niche pays per view. All 13 covered there.
What Are the Highest-paying YouTube Niches in 2026?
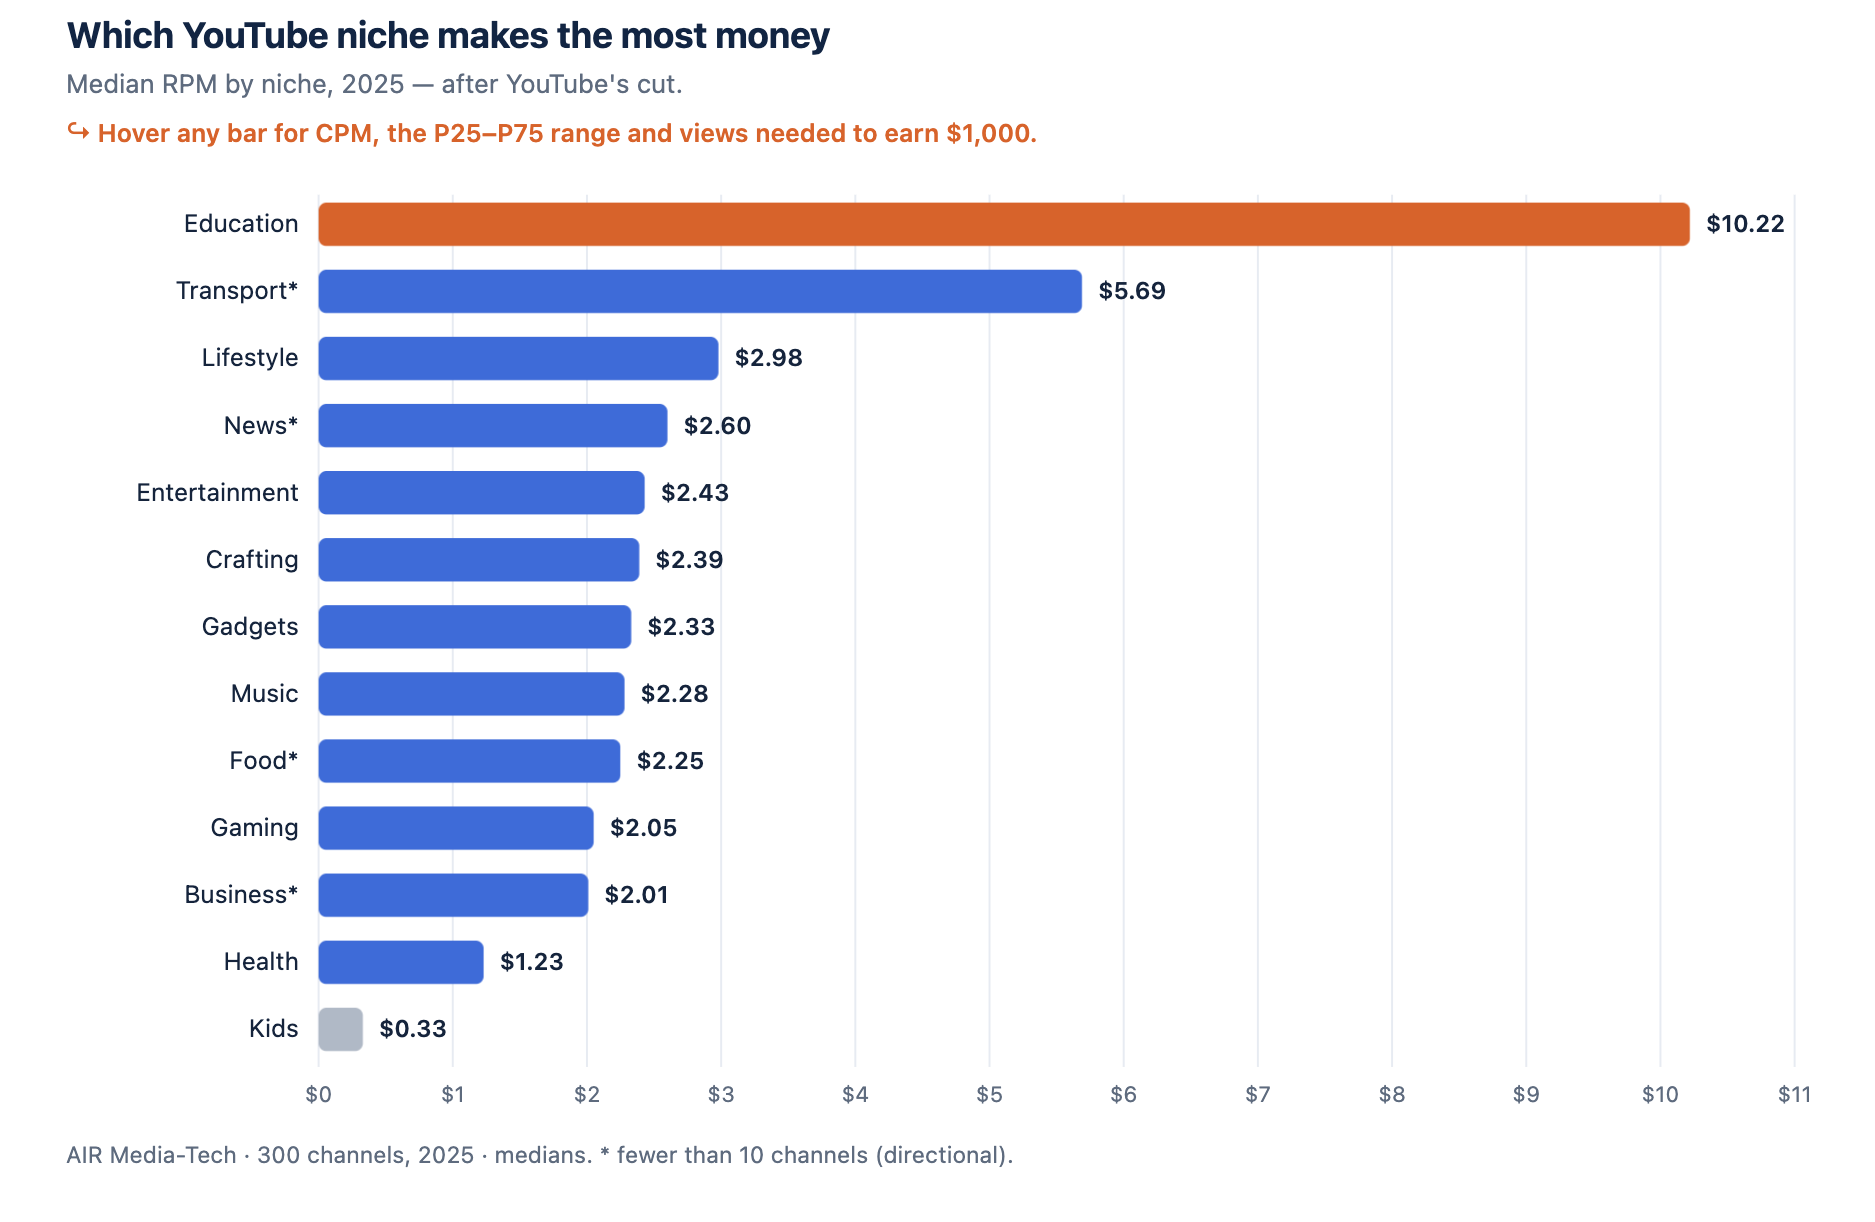
Education is the highest-paying YouTube niche, with a median RPM of $10.22 – more than four times the all-niche median and roughly thirty times what kids' content earns. Below Education, the ranking is tighter than most creators assume.
RPM by niche, 2026
The full ranking, sorted by median RPM:
|
Niche |
Median RPM |
Typical range (P25–P75) |
Median Studio CPM |
Advertiser CPM* |
Views to earn $1,000 |
|
Education & Science |
$10.22 |
$2.31 – $19.50 |
$5.91 |
$9.5–$12 |
~98,000 |
|
Transport* |
$5.69 |
$3.17 – $9.81 |
$5.88 |
$9.5–$12 |
~176,000 |
|
Lifestyle |
$2.98 |
$1.77 – $5.24 |
$5.32 |
$8.5–$10.5 |
~336,000 |
|
News & Politics* |
$2.60 |
$1.79 – $3.62 |
$4.51 |
$7–$9 |
~385,000 |
|
Entertainment |
$2.43 |
$0.88 – $5.02 |
$3.98 |
$6.5–$8 |
~412,000 |
|
Crafting & Handmade |
$2.39 |
$1.00 – $3.90 |
$3.42 |
$5.5–$7 |
~418,000 |
|
Gadgets & Tech |
$2.33 |
$0.70 – $3.71 |
$5.73 |
$9–$11.5 |
~430,000 |
|
Music |
$2.28 |
$1.35 – $4.16 |
$4.05 |
$6.5–$8 |
~439,000 |
|
Food & Cooking* |
$2.25 |
$1.50 – $3.11 |
$4.04 |
$6.5–$8 |
~445,000 |
|
Gaming |
$2.05 |
$0.70 – $3.62 |
$4.05 |
$6.5–$8 |
~487,000 |
|
Business & Finance* |
$2.01 |
$0.73 – $5.17 |
$4.84 |
$7.5–$9.5 |
~498,000 |
Every figure is a median, not an average, so one viral channel cannot drag the number up. Niches marked with an asterisk had fewer than ten channels in the sample, so treat those as directional rather than precise.
Median Studio CPM is the real, measured rate pulled from each channel’s YouTube Studio. Advertiser CPM is the pre-cut estimate that third-party tools like Social Blade publish – the figure creators usually quote. It runs roughly 1.5–2× higher because it counts only ad impressions, and cannot see a channel's monetized-playback rate, ad load, or audience region from the outside. Only Studio access reveals what lands in your account, and that is the Median Studio CPM shown here.
Education pulls high RPMs because the audience arrives with intent, advertisers pay a premium for that attention, and almost four in five of those views serve an ad.
The middle of the table – Entertainment through Business – looks like one tight cluster, but these are medians. Inside any of those niches, one channel's audience can be far more targeted, and far more valuable to advertisers, than another's, so two channels in the same niche often earn very differently. The spread below shows exactly that.
Which raises the real question.
Does Your Niche Decide Your RPM?
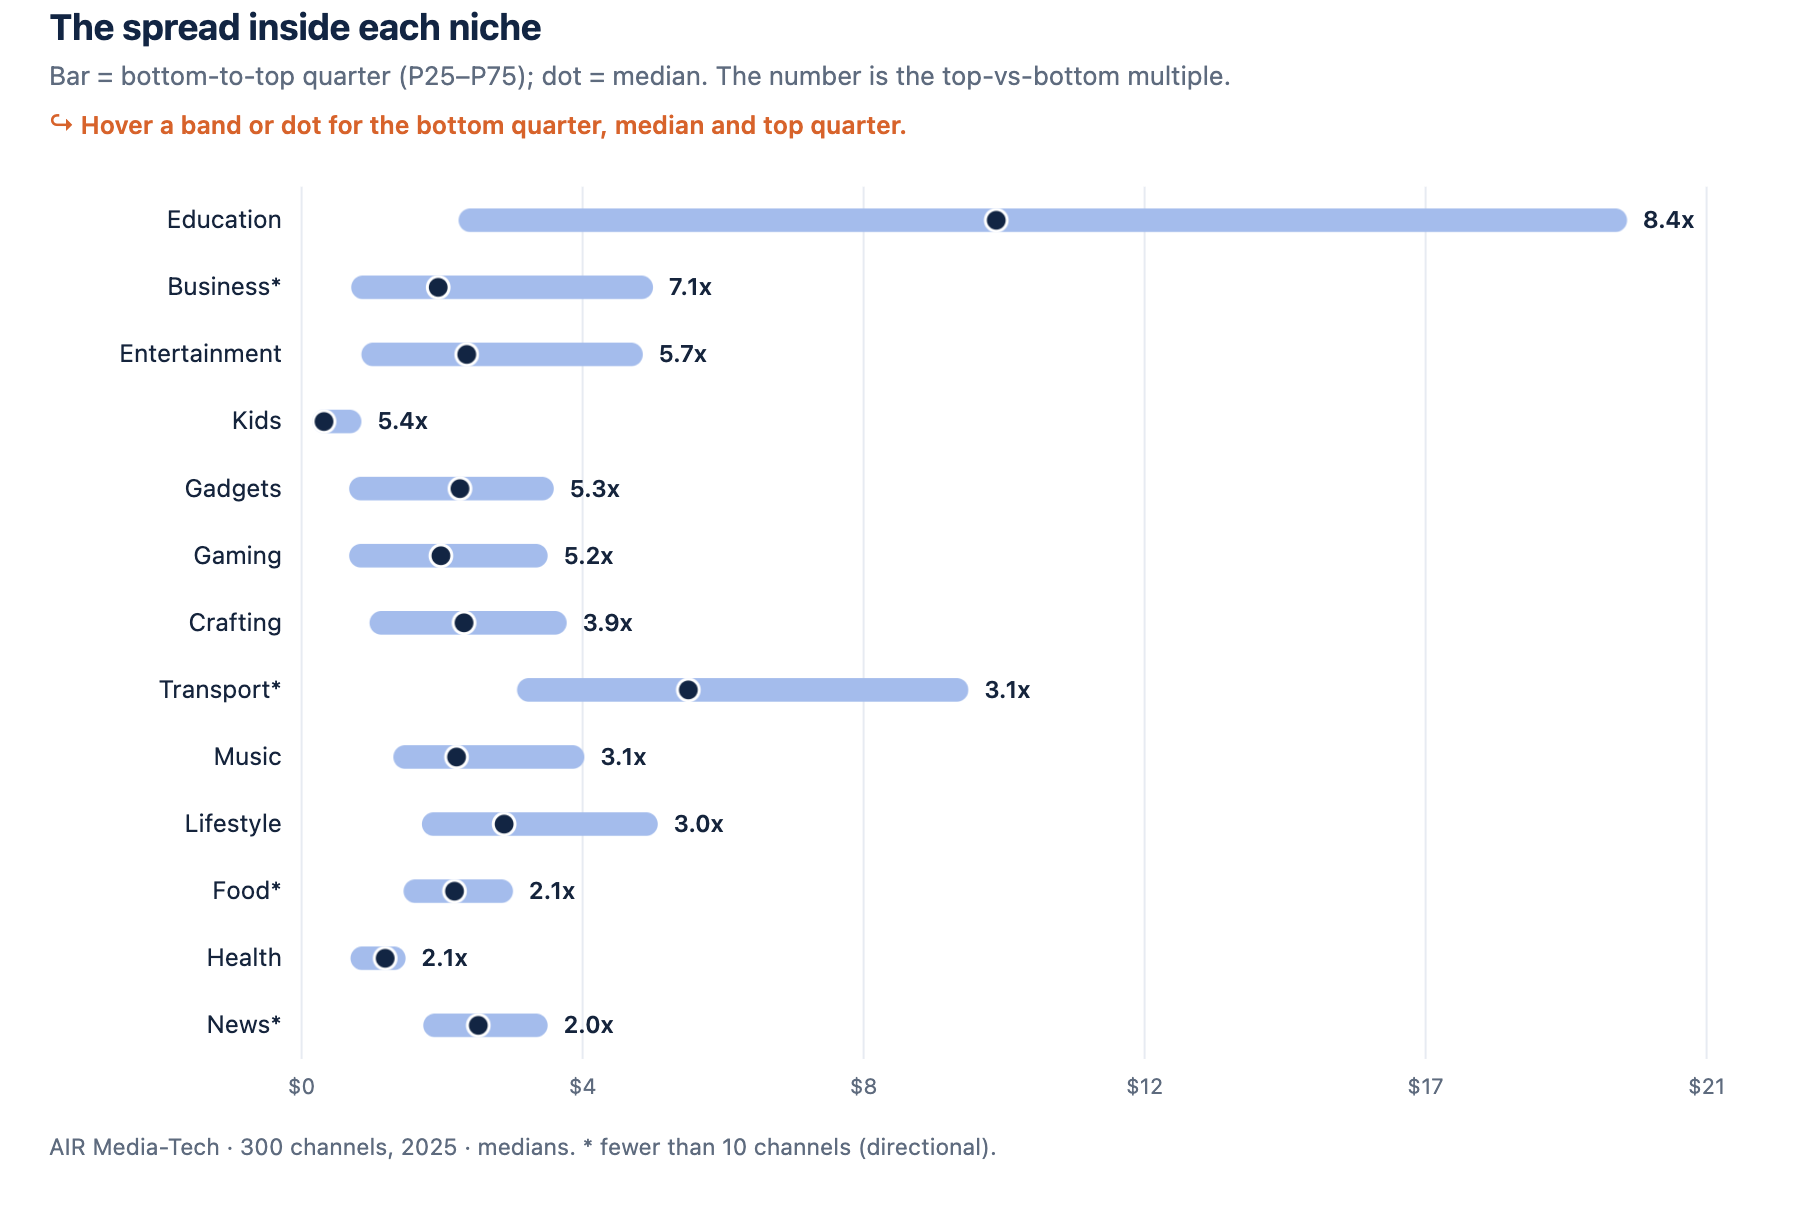
Less than you think. The spread inside a niche is usually wider than the gap between niches. Two Education channels can sit at $2.31 and $19.50. Two Gaming channels at $0.70 and $3.62. The middle 50% of each niche is shown below, with the median channel marked.
Within-niche RPM spread
|
Niche |
Bottom quarter |
Median |
Top quarter |
Top vs bottom |
|
Education & Science |
$2.31 |
$10.22 |
$19.50 |
8.4× |
|
Business & Finance* |
$0.73 |
$2.01 |
$5.17 |
7.1× |
|
Entertainment |
$0.88 |
$2.43 |
$5.02 |
5.7× |
|
Kids & Teens |
$0.16 |
$0.33 |
$0.88 |
5.4× |
|
Gadgets & Tech |
$0.70 |
$2.33 |
$3.71 |
5.3× |
|
Gaming |
$0.70 |
$2.05 |
$3.62 |
5.2× |
|
Crafting & Handmade |
$1.00 |
$2.39 |
$3.90 |
3.9× |
|
Music |
$1.35 |
$2.28 |
$4.16 |
3.1× |
|
Transport* |
$3.17 |
$5.69 |
$9.81 |
3.1× |
|
Lifestyle |
$1.77 |
$2.98 |
$5.24 |
3.0× |
|
Food & Cooking* |
$1.50 |
$2.25 |
$3.11 |
2.1× |
|
Health & Sport |
$0.72 |
$1.23 |
$1.53 |
2.1× |
|
News & Politics* |
$1.79 |
$2.60 |
$3.62 |
2.0× |
Education has the widest spread of all: its top quarter earns more than eight times its bottom quarter. Business and Entertainment run five to seven times. Even tight niches like Music and Gaming show a three-to-five-times gap between their best and worst earners. The only niches where the spread compresses are the ones near the floor, where there simply is not much room to fall.
Read that again, because it reframes the whole “best niche” question.
If a typical Gaming channel earns $2.05 but the top quarter of Gaming channels clear $3.62, then moving up within your niche is worth more than switching niches. A creator agonizing over whether to pivot from Gaming to Tech is chasing a $0.28 median difference while ignoring a $2.92 gap that already exists among gamers.
What separates the top of a niche from the bottom is rarely the content. In most cases, it is the monetization mechanics most creators never look at: how many of their views serve an ad, how many ads each view carries, and whether the channel is accidentally flagged in a way that strips its rates. We get into all of those below.
You can learn how channels with the same subscriber count can earn 10X different revenue here. We dissected 6 cases there.
The channel half your size is out-earning you. Why?
Same niche, fewer subscribers, higher RPM. It happens constantly, and the cause is almost never the videos. AIR's specialists have audited 3,000+ channels and can pinpoint what is capping yours. → See what's capping your RPM.
Why is Your RPM Lower Than the Numbers You See Online?
Because the big numbers floating around are CPM, and you get paid in RPM. They are not the same metric, and the difference is most of your missing money.
CPM is what an advertiser pays for 1,000 ad impressions, before YouTube takes anything. RPM is what lands in your account per 1,000 views, after YouTube’s 45% cut and after counting every view that never showed an ad at all. YouTube’s own help docs spell out the split.
When a creator says “my niche does $15 CPM,” they are quoting the advertiser-estimate figure, the most flattering number in the dashboard, and skipping the three deductions between it and reality. That inflated figure is also what third-party estimators, because they guess from the outside and cannot see your monetized-playback rate, ad load, or revenue share – the deductions only YouTube Studio reveals, which is the access this study is built on.
Watch it happen with Gadgets.
Advertisers value tech audiences, so the advertiser-estimated CPM runs around $9 to $11. The Studio CPM is $5.73. And the actual RPM? $2.33. The number shrinks at every step, and the published “Tech pays $12” claim describes a world the creator never sees.
So when you compare your dashboard against a number you read online, you are usually comparing your after-cut RPM against someone else’s before-cut, cherry-picked CPM. Two different metrics wearing the same dollar sign.
If a single rule of thumb could fix this confusion, it is this: take any CPM you see quoted, cut it roughly in half for YouTube’s share, then cut it again for the views that never served an ad. What is left is close to your real RPM. Everything in this study is that “what is left” number.
How Often do Your Views Show an Ad?
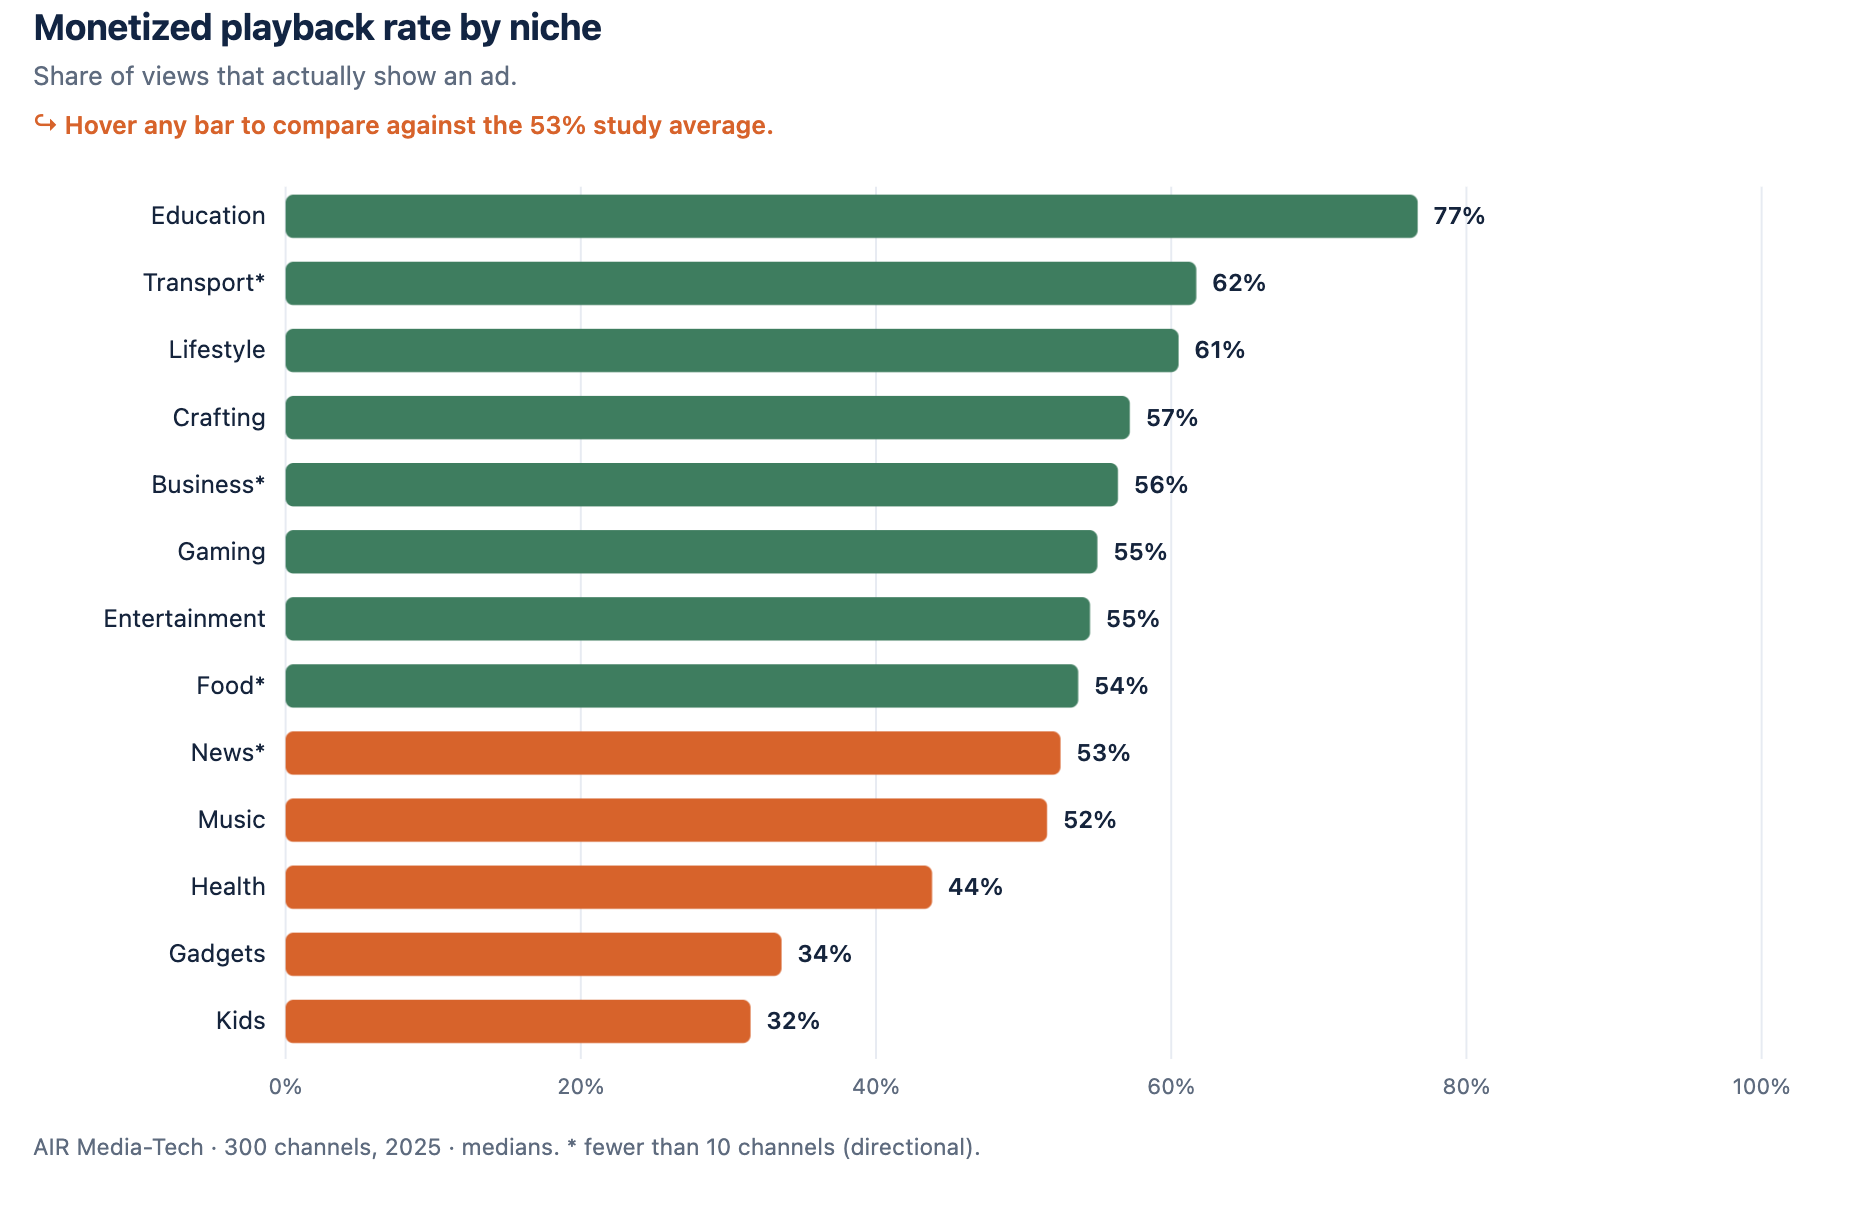
This is the deduction nobody mentions, and it is the engine behind the entire CPM-to-RPM gap. Not every view earns money. A view only pays when it serves an ad, which YouTube calls a monetized playback, and across our 300 channels the median channel monetized just 53% of its views. Almost half of the average channel’s traffic generated nothing.
Monetized playback rate by niche
|
Niche |
Views that show an ad |
Niche |
Views that show an ad |
|
Education & Science |
77% |
Food & Cooking* |
54% |
|
Transport* |
62% |
News & Politics* |
53% |
|
Lifestyle |
61% |
Music |
52% |
|
Crafting & Handmade |
57% |
Health & Sport |
44% |
|
Business & Finance* |
56% |
Gadgets & Tech |
34% |
|
Gaming |
55% |
Kids & Teens |
32% |
|
Entertainment |
55% |
The spread by niche explains much of the RPM table you saw earlier. Education monetizes 77% of its views, the highest of any niche, because viewers watch longer, sit through ads, and the content is advertiser-friendly.
Kids content monetizes 32% and Gadgets just 34%, and both pay far less than their CPM would suggest, precisely because so much of their traffic never reaches the advertiser. A Gadgets channel can post a healthy $5.73 CPM and a $2.33 RPM at the same time, because only a third of its views ever serve an ad.
This is the lever most creators have never heard of, and it is fixable.
Short watch sessions, retention drop-offs before the first mid-roll, ad settings left half-configured, traffic from regions that barely monetize: each one lowers the share of views that pay. Two channels with identical CPMs and identical view counts can earn double or half of each other on this number alone.
Half your views may never show an ad. Do you know which half?
Monetized playback rate is invisible on the surface and brutal on your revenue. An AIR audit reads it line by line and shows where the paying views leak out. → Find your revenue leaks.
How Many Ads Does Each View Carry?
The second hidden lever is ad load, the number of ads a monetized view serves. More ads per view means more revenue per view, as long as you do not bury the audience. Across the sample, the median view that did monetize carried about 1.55 ads.
That number moves with niche and format. Long videos with room for several mid-rolls carry more; short videos carry one or none.
|
Niche |
Ads per monetized view |
Niche |
Ads per monetized view |
|
Transport* |
2.55 |
Food & Cooking* |
1.59 |
|
Crafting & Handmade |
1.90 |
Music |
1.56 |
|
Education & Science |
1.84 |
Gaming |
1.44 |
|
News & Politics* |
1.71 |
Business & Finance* |
1.39 |
|
Gadgets & Tech |
1.71 |
Health & Sport |
1.39 |
|
Lifestyle |
1.69 |
Kids & Teens |
1.29 |
|
Entertainment |
1.64 |
Transport leads, helped by long videos with several mid-rolls. Crafting and Education sit high because people watch a tutorial to the end. Kids content carries the fewest, partly because the videos are short and partly because the format limits where ads can go.
Ad load is the lever you control most directly. A ten-minute video can hold multiple mid-rolls; an eight-minute video struggles to hold one. Pacing your content so there are natural break points, and turning on the mid-roll slots YouTube offers, is often the fastest legitimate RPM gain available, no audience growth required. We trained our own AI tool on thousands of channels to place ad breaks where they earn the most without hurting retention.
Does a Bigger Channel Earn a Higher RPM?
No.
Subscriber count barely predicts RPM at all.
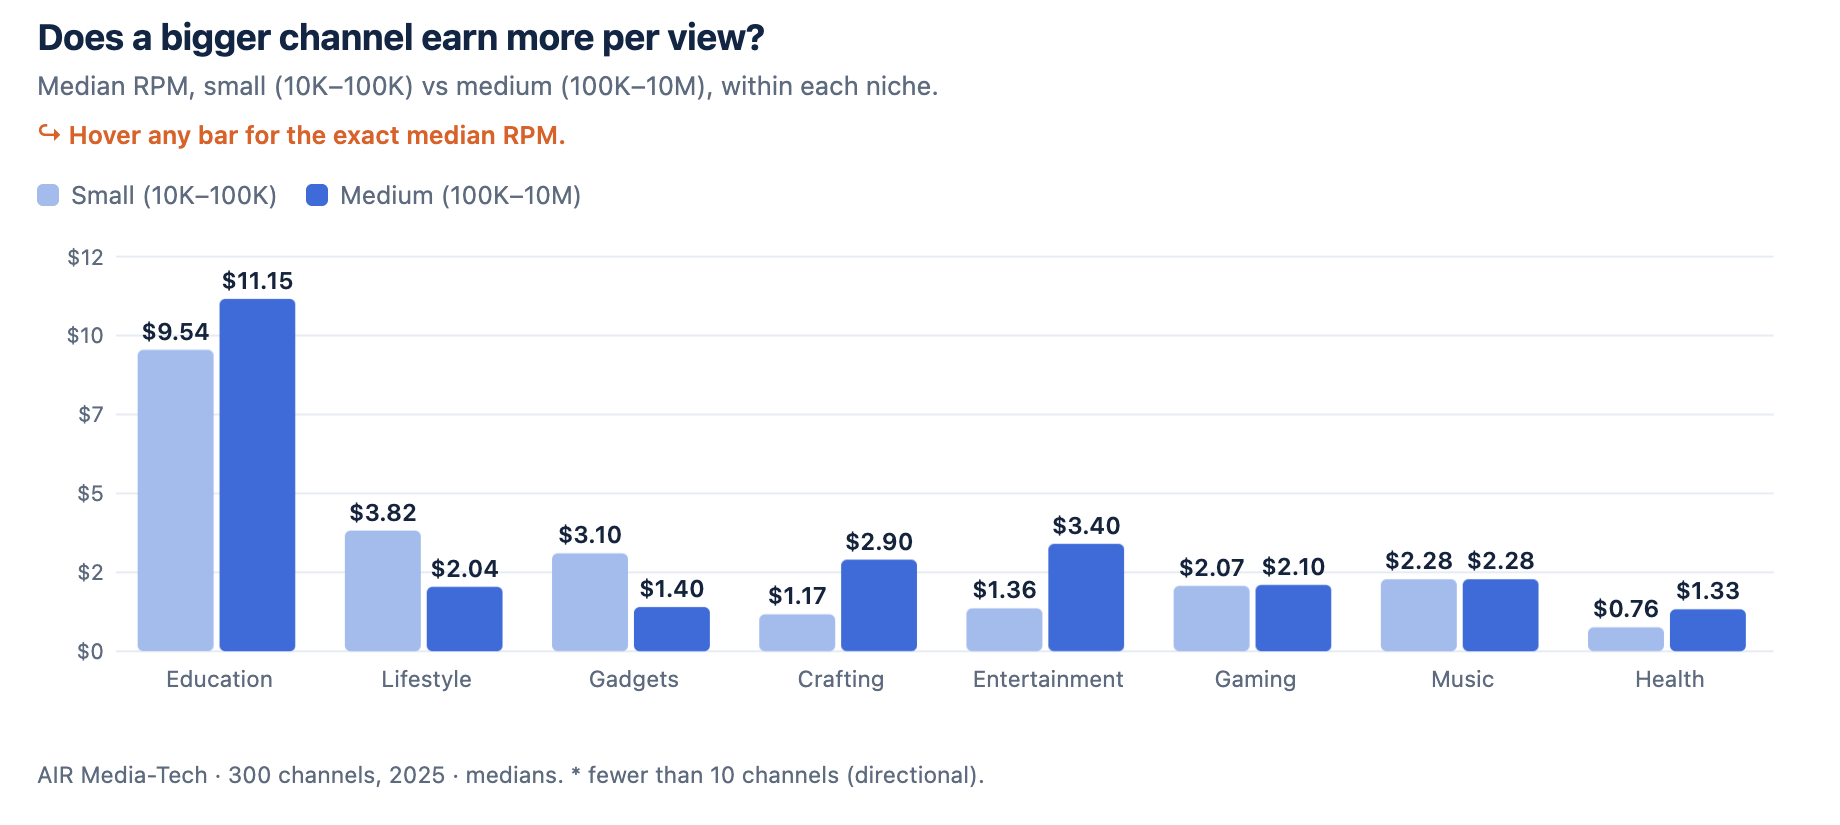
We split every channel into size tiers, and the medians come out nearly flat: small channels (10K–100K subs) sit around $2.14, medium channels (100K–10M) around $2.04. Bigger is not richer, at least not per view. That is the pooled picture; inside individual niches the small- and medium-channel medians can differ by a few dollars in either direction, as the table below shows.
Small vs medium channels by niche
Look within niches and the “size advantage” disappears entirely.
In Lifestyle, small channels ($3.82) out-earn medium ones ($2.04). In Gadgets, small ($3.10) more than doubles medium ($1.40). In Music and Gaming, small and medium land within pennies of each other. Education and Entertainment lean the other way, with medium channels ahead, but no consistent rule survives across niches.
|
Niche |
Small (10K–100K) |
Medium (100K–10M) |
Who wins |
|
Education & Science |
$9.54 |
$11.15 |
Medium |
|
Lifestyle |
$3.82 |
$2.04 |
Small |
|
Gadgets & Tech |
$3.10 |
$1.40 |
Small |
|
Crafting & Handmade |
$1.17 |
$2.90 |
Medium |
|
Entertainment |
$1.36 |
$3.40 |
Medium |
|
Gaming |
$2.07 |
$2.10 |
Tied |
|
Music |
$2.28 |
$2.28 |
Tied |
|
Health & Sport |
$0.76 |
$1.33 |
Medium |
The reason is simple. RPM is a per-view rate, and a million subscribers does not make a single view worth more. A small channel with a tightly targeted, high-intent audience in a wealthy region can out-earn a giant whose views are scattered and shallow. Subscribers grow your total revenue by adding views, but they do not lift the rate. So if your channel is stuck, “get bigger” is rarely the fix. “Monetize what you already have, better” usually is.
Subscribers don't lift RPM; mechanics do. An audit shows which levers a smaller channel has dialed in, and yours hasn't. → Find your rate gap.
Do More Uploads Mean More Money Per View?
Not in a straight line. We ranked channels by how many videos they published within a year and checked the RPM of each group. The relationship is U-shaped, not a ramp.
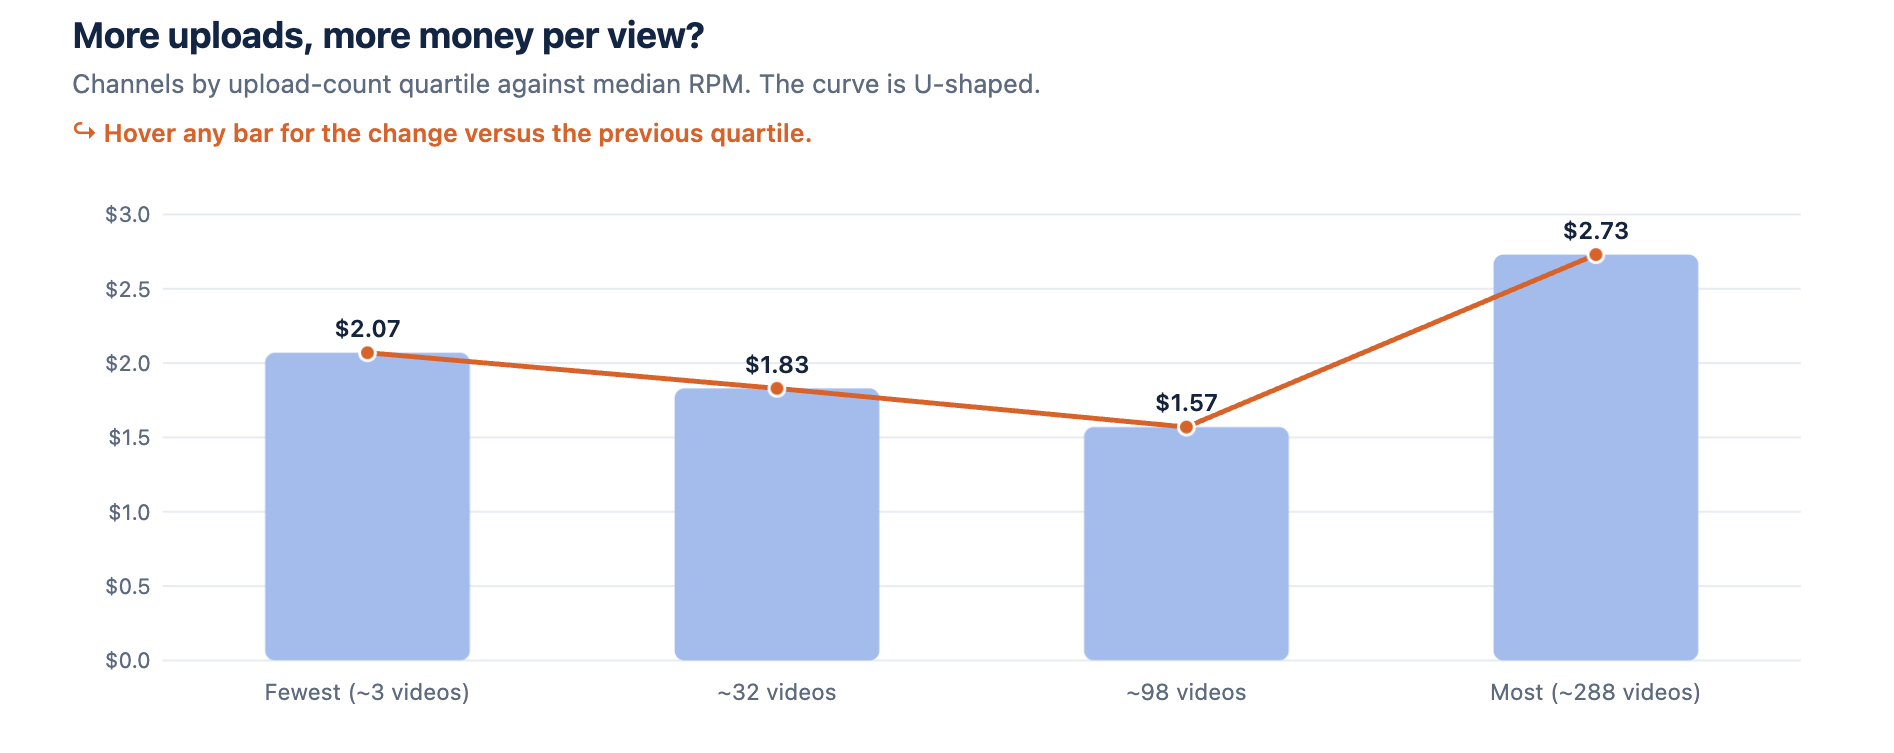
Upload volume vs RPM
The channels that published the fewest videos (around 3 a year) posted a $2.07 median RPM. The middle groups dipped to $1.57. And the channels publishing the most (around 288 videos a year) came back up to $2.73. Statistically, upload count and RPM barely correlate at all.
|
Upload group |
Videos in 12 months (median) |
Median RPM |
|
Lowest quarter |
~3 |
$2.07 |
|
Second quarter |
~32 |
$1.83 |
|
Third quarter |
~98 |
$1.57 |
|
Highest quarter |
~288 |
$2.73 |
Two different strategies sit at the two high points.
The low-volume, high-RPM channels tend to be deliberate: a few long, dense videos built to be watched to the end, which lifts both the monetized rate and the ad load.
The high-volume channels win on a different axis, feeding the algorithm constantly and accumulating enough total views that even a modest rate compounds into real money. The trap is the middle: enough videos to stretch quality thin, not enough to build a volume flywheel.
Cranking out more mediocre uploads is the one move the data does not reward — and the penalty compounds over time. In gaming and education, channels with 1,000+ videos get 11–18x fewer views on new uploads than channels with under 50, not because posting more is the problem, but because the dead content those archives accumulate progressively narrows the audience pool available for everything the channel publishes next. The volume trap is the ratio of weak videos to strong ones."
Who Earns the Money on YouTube?
A small minority. When we add up real ad revenue across all 300 channels, the top 10% of channels captured 58% of the total money. The top quarter took 82%. The bottom half of all channels split just 4% between them.
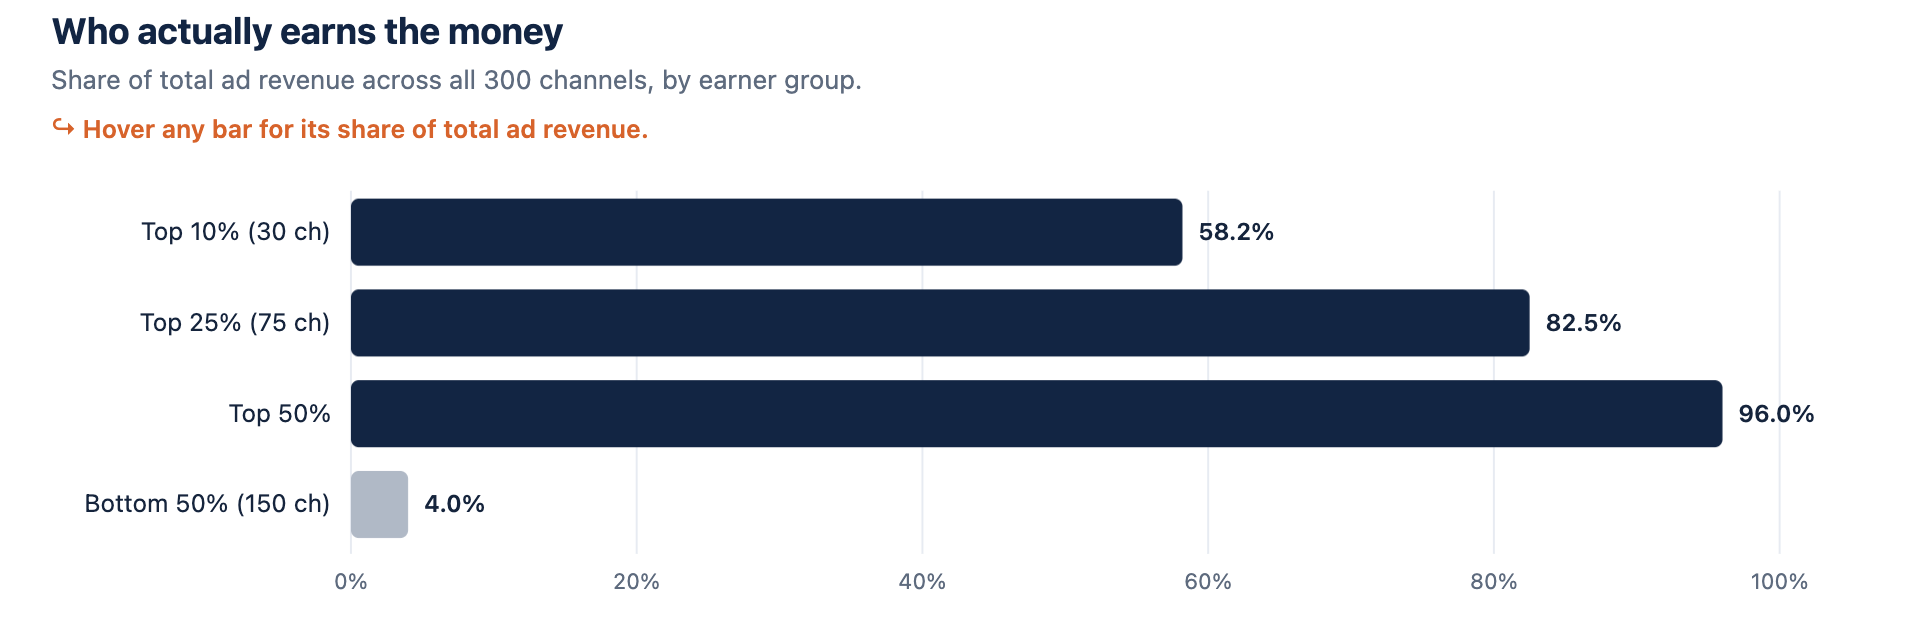
Revenue concentration across 300 channels
|
Channel group |
Share of total ad revenue |
|
Top 10% (30 channels) |
58% |
|
Top 25% (75 channels) |
82% |
|
Top 50% |
96% |
|
Bottom 50% (150 channels) |
4% |
The top earners are not clustered in the richest niches. They are spread across Gaming, Music, Entertainment, and Education alike. What they share is execution – high monetized rates, healthy ad loads, clean settings, and audiences in paying regions. The niche got them into the room, yet the mechanics decided who left with the money.
The flip side is the opportunity.
If the gap between the top and the bottom is mostly mechanical rather than topical, then it is closeable without changing your content, your face, or your subject. The channels in that top decile are not doing something you cannot. They are doing things you may not have audited yet.
The difference is mechanical, which means it is findable. AIR has mapped what separates top-decile channels from the rest across 3,000+ audits. → Compare your channel to the top 10%.
When is YouTube RPM Highest During the Year?
Two things move RPM across the calendar, and both are predictable enough to plan around. Rates peak in Q4 and crater in January.
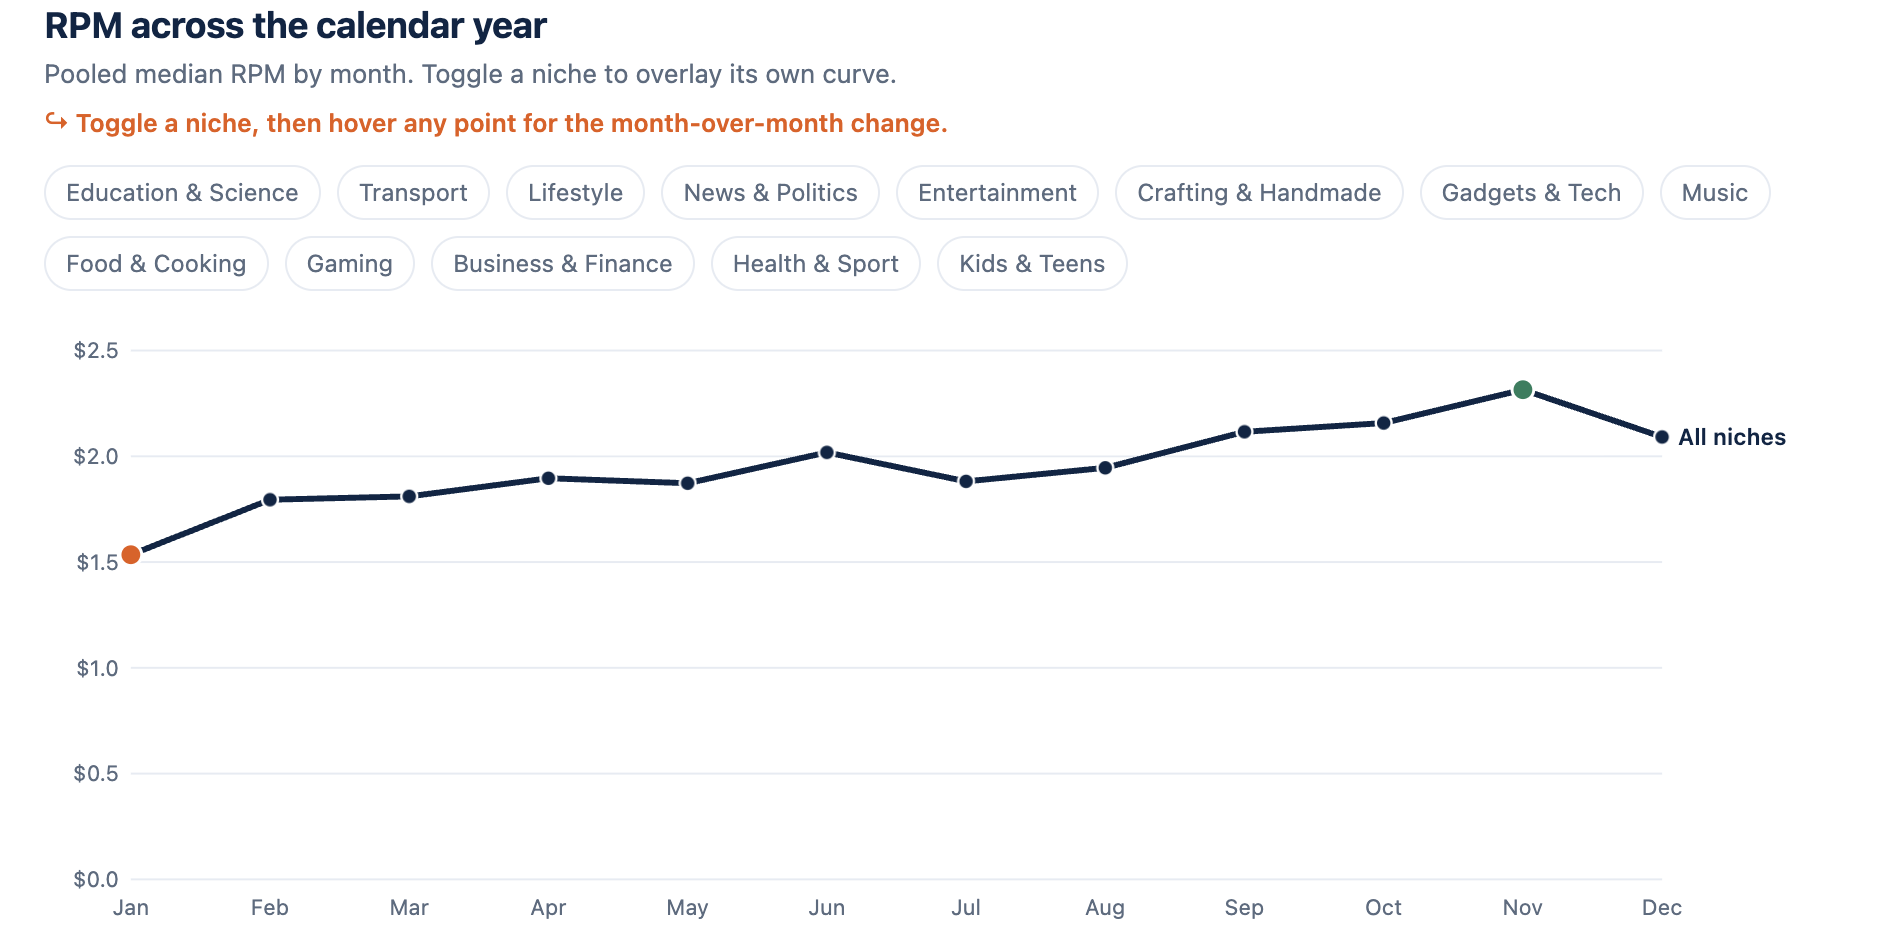
Monthly RPM across the year
Pooled across all niches, the median RPM climbs through autumn to a November peak of $2.35, as Black Friday and holiday advertisers bid for attention, then falls off a cliff.
January came in at $1.56, roughly 34% below the November peak and 27% below December. Advertiser budgets reset, the holiday rush ends, and the per-view rate drops hard for four to six weeks before slowly recovering.
|
Month |
Median RPM |
Month |
Median RPM |
|
January |
$1.56 |
July |
$1.91 |
|
February |
$1.82 |
August |
$1.98 |
|
March |
$1.84 |
September |
$2.15 |
|
April |
$1.93 |
October |
$2.19 |
|
May |
$1.90 |
November |
$2.35 |
|
June |
$2.05 |
December |
$2.12 |
The Q4 lift is not evenly shared. Some niches barely notice it; others swing violently.
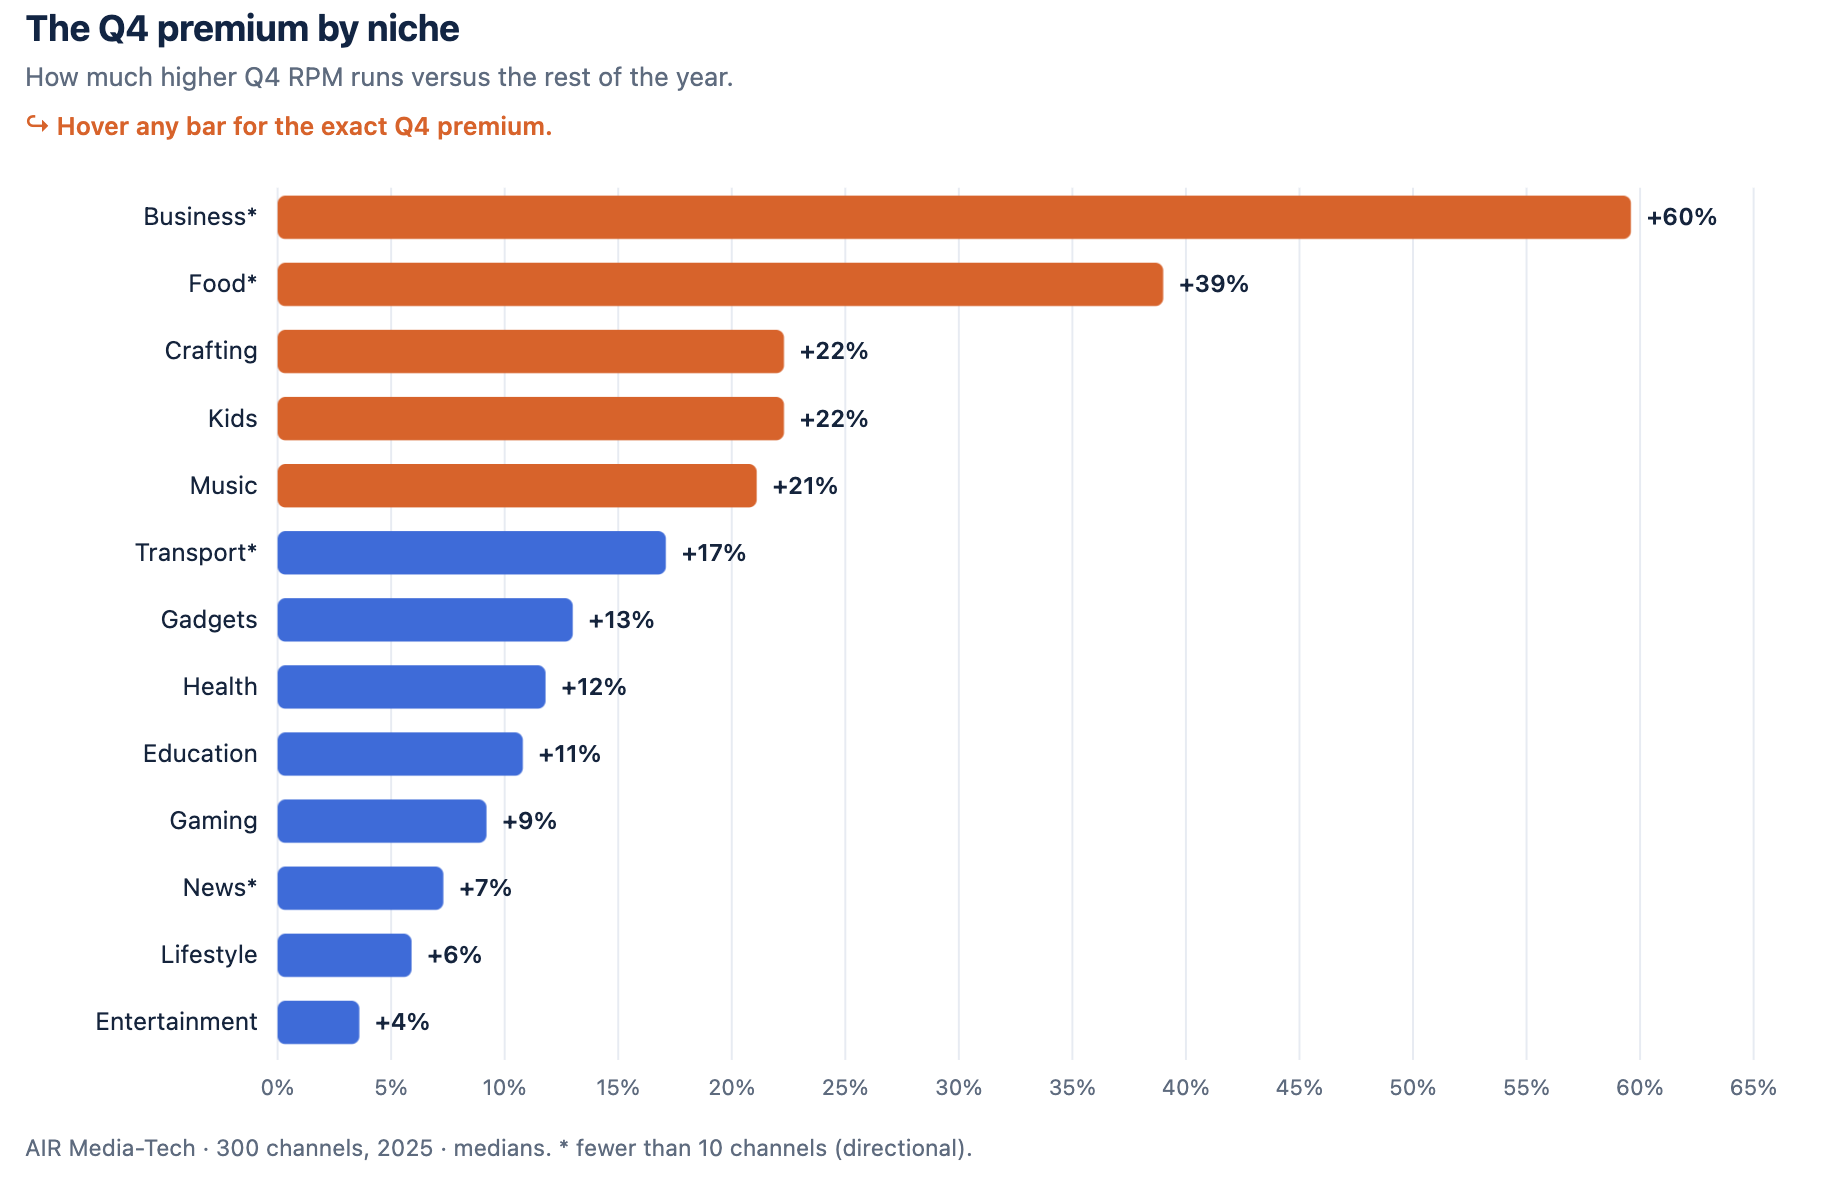
Q4 RPM premium by niche
Business & Finance jumps nearly 60% in Q4, Food about 39%, and Crafting, Music, and Kids all clear 20%. Education and Entertainment, already steady year-round, move only a few percent. If your niche is on the high-swing end, the calendar is a planning tool: hold your strongest, most ad-friendly uploads for October and November, and do not judge your channel’s health by a January dashboard that is structurally depressed for everyone.
|
Niche |
Q4 RPM premium |
Niche |
Q4 RPM premium |
|
Business & Finance* |
+60% |
Health & Sport |
+12% |
|
Food & Cooking* |
+39% |
Education & Science |
+11% |
|
Crafting & Handmade |
+22% |
Gaming |
+9% |
|
Kids & Teens |
+22% |
News & Politics* |
+7% |
|
Music |
+21% |
Lifestyle |
+6% |
|
Transport* |
+17% |
Entertainment |
+4% |
|
Gadgets & Tech |
+13% |
There are workarounds to play with seasonality.
- One lounge music creator AIR worked with launched culturally timed livestreams and localized metadata across four languages going into January — the worst stretch of the year for the niche — and retained 78% of holiday-season revenue while the category median dropped 40–60%.
- A kids channel network that followed AIR's recommendation to increase publishing frequency ahead of the New Year window went from 24 million to 299 million views in one quarter. The Q4 lift and the January drop are predictable. Build toward them.
Read those to figure out when to peak your activity and how.
Want the Niche-by-Niche Breakdown?
This study covers what a YouTube view is worth across the platform and the levers that move it. If you want the numbers for your own niche — what each pays, why their rates differ, and the seasonal swings specific to each – we broke all 13 down here.
What This Means for Your Channel
If you take three things from 3,595 channel-months of real data, take these.
- Your niche sets your floor, not your income. The gap between the best and worst earners inside a single niche is bigger than the gap between most niches, which means the work that pays off most is almost never “switch topics.” Usually, it’s climbing within the niche you already have.
- The levers that decide where you land are mechanical and mostly invisible: the share of your views that serve an ad, the number of ads each view carries, and whether your settings and audience flags are quietly capping your rate. None of those show up in the RPM number YouTubers quote, and all of them are auditable.
- The calendar is a tool. Rates peak in November and bottom out in January. Plan your strongest uploads for Q4, and never judge your channel by a January dashboard.
And a large share of creator income never touches the RPM number at all. Sponsorships, products, memberships, and other formats often out-earn ad revenue, especially for channels with a focused, high-trust audience. Ad rates are the floor this study measures; the ceiling is built off-platform.
From the Sample to Your Dashboard
This study shows what a view is worth across YouTube and which levers move it. What it cannot show is which of those levers is capping your channel right now. That answer lives in your own Analytics: your monetized-playback rate, your ad placements, your audience flags, your settings.
AIR’s specialists have audited more than 3,000 channels and found those gaps for them – and can find yours, too. An audit reads the same data we used here, but for your channel, and shows you exactly where the paying views are leaking and which levers will move your rate.
What you get:
- A structured report across packaging, retention, traffic sources, format mix, revenue structure, and audience behavior.
- A 30-day action plan ranked by impact.
- A 45–60-minute live walkthrough with a senior AIR strategist.


