
![First 500M Subscriber Award, Creator Consultation, Search Profiles, and More [June 2026]](https://air.io/storage/3FBRm5HTWaDBrOmkopJzVIJKijxnTYH2VSXZfKnv.jpg "First 500M Subscriber Award, Creator Consultation, Search Profiles, and More [June 2026]")


If you’ve ever typed into a search bar “how long should my YouTube videos be,” then you’ve already read the same “it depends on the niche” over and over again. We have good news for you here! After analyzing 4,538,463 videos across 18,080 English-language channels, we can tell you exactly the length that drives engagement in each niche, with the numbers to back it up.
What Is the Ideal YouTube Video Length?
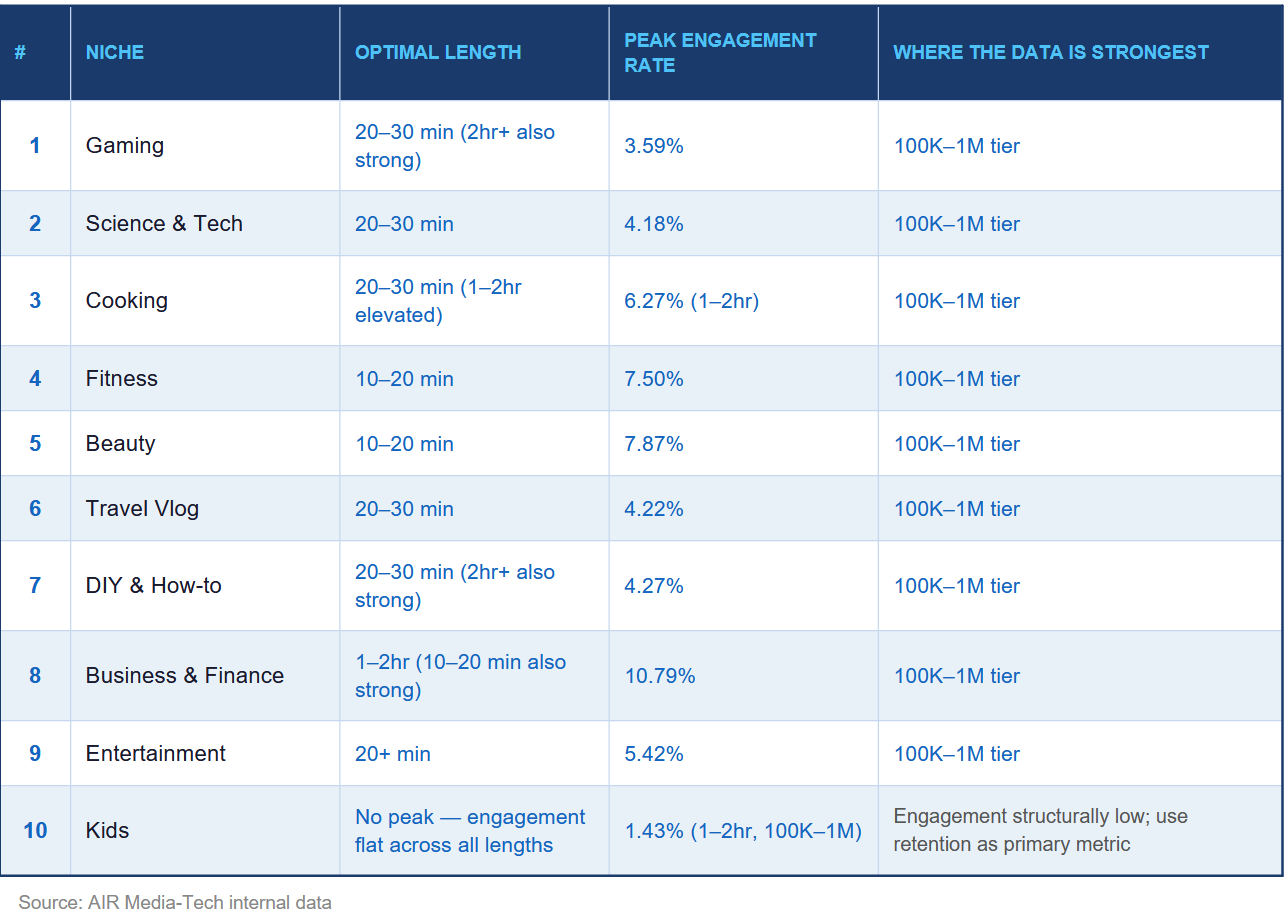
Longer videos outperform shorter ones in almost every niche — but the degree varies, and the sweet spot differs depending on what you make. Here's what the data from 4,538,463 videos across 18,080 channels shows:
- Gaming and DIY channels peak at 20–30 minutes, with the longest formats (1–2 hours and 2hr+) holding the strongest engagement at every size tier.
- Business and finance channels show the highest engagement numbers in the study at 1–2 hours — 10.79% at the 100K–1M tier, a number that stands apart from every other niche.
- Fitness and cooking channels peak at 10–20 minutes, with meaningful gains over sub-10-minute formats at every tier.
- Tech channels perform strongest at 10–20 minutes, with the gap between that range and 5–10 minutes growing wider at larger channel sizes.
- Kids' channels are the exception: engagement rate is flat across all lengths at every scale. Retention percentage, not engagement rate, is what drives distribution here.
The consistent pattern across every niche: the 5–10 minute range is where most creators default, and it's not where the highest engagement concentrates — in any niche, at any channel size.
If you’re short on time, save this answer table!
A consistent pattern runs through every niche: engagement rates are highest at the 100K–1M tier and decline as channel size grows. This is the micro-influencer effect — smaller, more loyal audiences engage proportionally more per video than mass audiences. It also means the length patterns are clearest and most actionable for mid-size creators, which is the audience this research targets.
Does Video Length Matter to YouTube’s Algorithm?
In short, the video length itself doesn’t matter much to the algorithm, but there’s a but. YouTube’s current algorithm ranks videos by satisfaction signals (aka comments, likes, watch time, and audience retention).
When a viewer watches 80% of your 15-minute video, YouTube registers a strong match between your content and that viewer’s intent. It learns to show that video to more people like them. When a viewer exists at 20%, the algorithm pulls back on recommendations and reduces search visibility.
Engagement rate (likes + comments divided by views) adds a second layer. It tells YouTube whether the video generated enough of a reaction to justify distributing it further. Channels in the top-performing segment of their niche show distinct length patterns, patterns that differ significantly from those of lower-performing channels. That gap is what this research measures.
Watch time also has a direct revenue impact. More watch time means more ad inventory, higher mid-roll placement density, and better CPM from advertisers who pay a premium for completion.
An important wrinkle to name: higher engagement rates don’t always come from longer videos. The 5-10-minute range dominates in sheer video volume across all niches. In fact, it’s the most common length creators default to. In most niches, it’s not where the strongest engagement data concentrates.
Why are other channels outgrowing you?
It's not luck. There's a specific reason — and our specialists who've audited 3,000+ channels will find it in yours.
Show me what to fixHow We Ran This Study
We started with 22,294 channels that met the baseline criteria: English-language, outside low-earning regions, generating between 100K and 100M monthly views. After filtering out channels where 80% or more of the uploads were YouTube Shorts, and channels with no qualifying videos during the study window, the final working sample was 18,080 channels and 4,538,463 videos.
Time period: Videos published in 2025 and January-March 2026.
YouTube Shorts (videos under 180 seconds) were excluded from the entire analysis. Why? Because while YouTube Shorts do have a certain amount of influence on the long-form videos, they operate under different algorithmic mechanics and would distort engagement rate comparisons for long-form content.
After picking the channels for research, they were placed into one of four monthly view tiers:
- 100K–1M monthly views
- 1M–10M monthly views
- 10M–50M monthly views
- 50M–100M monthly views
What niches did we cover? Entertainment, Fitness, Gaming, Tech reviews, Travel vlog, Beauty, DIY & How-to, Business/Finance, Cooking, Kids
What We Measured
- Engagement rate per video: (likes + comments) / views × 100. This normalizes for view count differences and reflects genuine audience response.
- Views per subscriber ratio: views / subscribers. This normalizes performance across channels of very different sizes.
- Duration buckets: analyzed per niche across 5-minute intervals and larger bands (1-2hr, 2hr+).
Important: this is correlational data, not causal. The numbers show what high-engagement channels do; they don't prove length alone caused the result. Execution quality, topic selection, and packaging all contribute to an increase/decrease in engagement numbers. What the data rules out is the idea that video length is a minor variable, because the patterns across 4.5 million videos are too consistent to dismiss.
Ideal YouTube Video Length by Niche
The tables below show the core findings across all four channel size tiers. We expressed engagement rates as percentages for easier understanding. Let’s break it all down.
Jump to Your Niche
The data breaks down differently for each one. Click yours to go straight to the numbers.
- Gaming
- Tech reviews
- Cooking
- Fitness
- Beauty
- Travel vlogs
- DIY & how-to
- Business & finance
- Entertainment
- Kids
What Is the Ideal Video Length for Gaming Videos on YouTube?
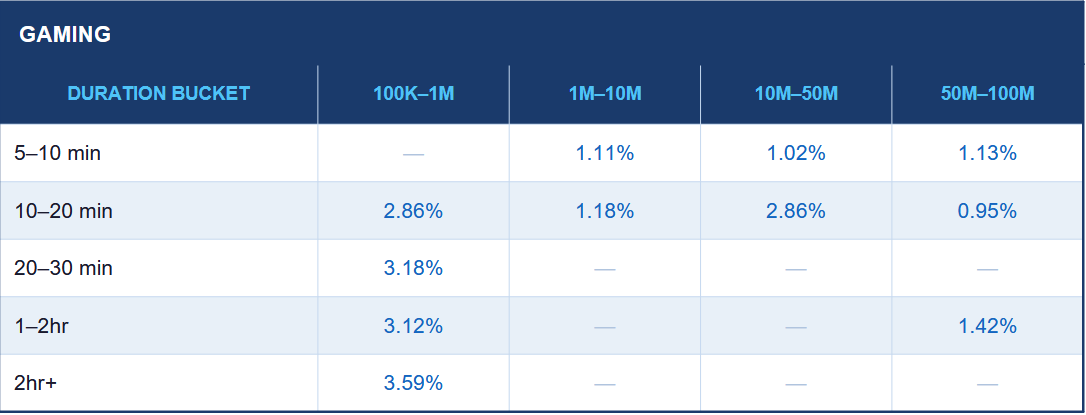
The gaming data shows a rather consistent pattern: engagement rate climbs with video length, at least at the 100K-1M tier. The 10-20 minute bucket produces 2.86%, the 20–30 minute bucket reaches 3.18%, the 1–2 hour category hits 3.12%, and 2hr+ peaks at 3.59%. The direction seems to be rather straightforward for gaming content; the longer videos drive more engagement per view among smaller audiences.
- At the 1M-10M tier, the signal narrows: 10-20 min produces 1.18% vs 1.11% for 5-10 min. Both are low compared to smaller channels, but the length advantage persists.
- At the 10M-50M tier, the split is more prominent: 10-20 min reaches 2.86% while 5-10 min falls to 1.02%.
- The reading seems the same as the 100K-1M, despite the channel being much larger, which means that the ‘engagement penalty’ for shorter gaming content intensifies along with the scale.
- At the 50M-100M tier, the picture shifts: 1-2hr content (1.42%) outperforms both 10-20 min (0.95%) and 5-10 min (1.13%). Even at a mass-reach scale, longer content holds a relative advantage in gaming.
But why does this shift happen? The engagement advantage of longer gaming videos (2.86% → 3.18% → 3.59% as the runtime grows at the 100K-1M tier) reflects who is watching and where.
Gaming happens to be one of the most TV-dominant niches on YouTube. Both streaming and long videos for gaming content are considered lean-back entertainment. Someone watching a long gaming stream on a TV is in the same behavioral mode as someone watching Netflix. That session length and attention quality are what drive higher RPM on streams versus uploads.
The platform data supports this because YouTube crossed 1 billion hours of daily TV watch time in 2025, and US TV viewership has overtaken mobile, and still does in 2026. Gaming content, by its nature, fits that context better than almost any other niche.
Gaming long-form content doesn't need to re-hook the viewer every 90 seconds the way a mobile-optimized video does. The TV viewer is already settled in. That's why a 25-minute gaming video outperforms a 7-minute one in engagement: the audience consuming it is in a fundamentally different physical and mental state.
The StrEat Gaming case puts a number on it: the channel (2.8M subs, 1.85B views) launched 24/7 Gyre streams, and streams became 83% of total watch hours and 80% of annual revenue, with the highest RPM on the channel, outperforming regular uploads. In fact, 30%+ of stream views came from TV in the US.
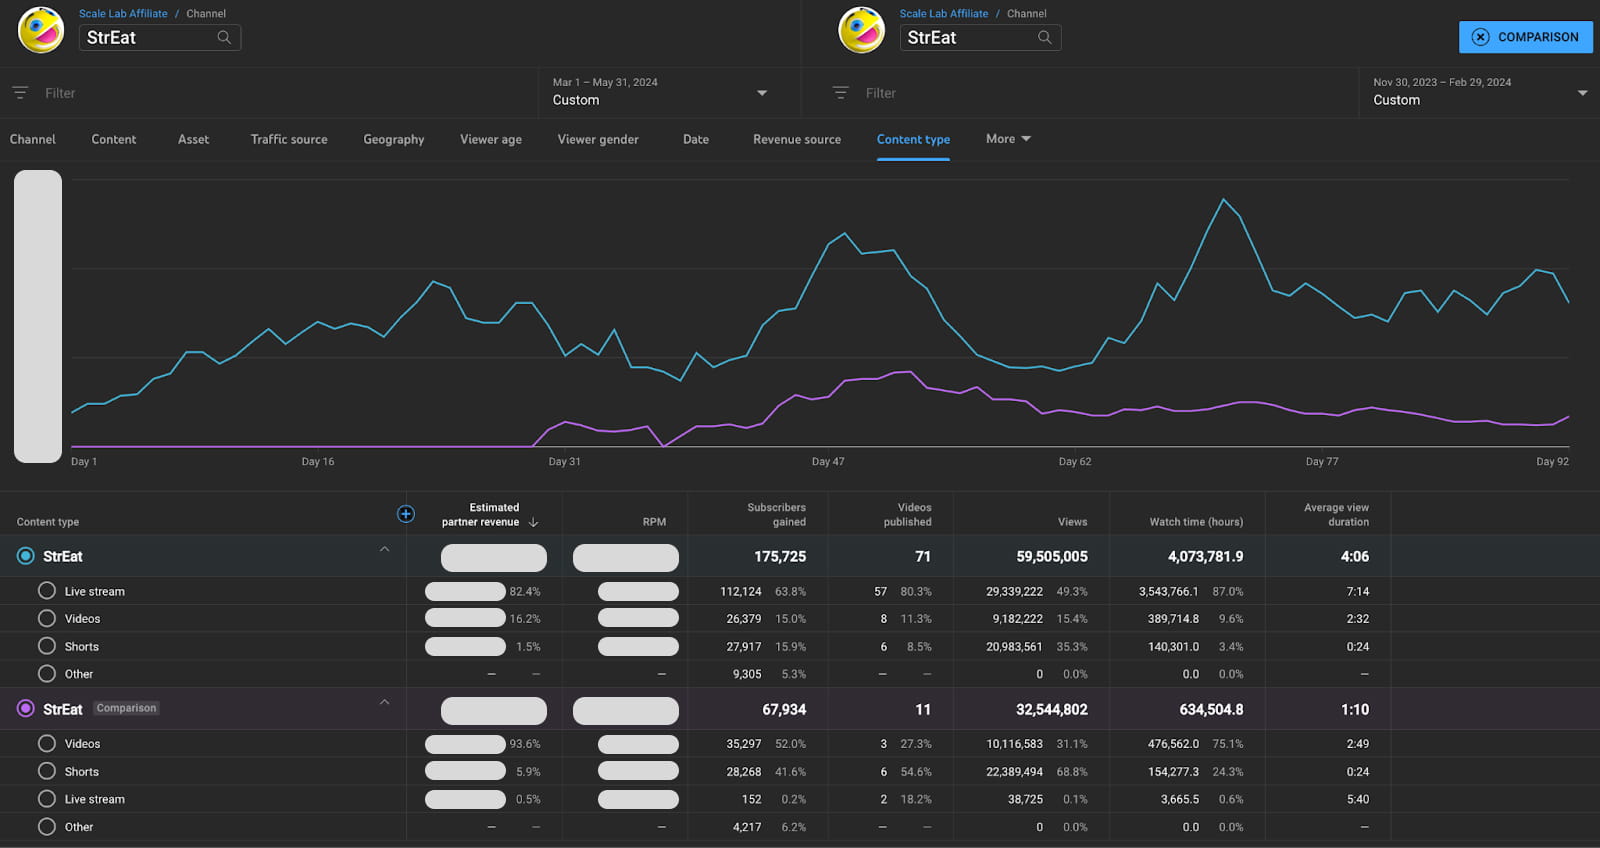
What is the practical implication of this for most gaming creators? First, 5-10 minute gaming clips happen to be the most common format in the niche, with the weakest engagement across all four channel tiers. The highest-performing videos are the longest, as well as streams. This means that to better your engagement with your longer videos, focus on investing in a TV optimization strategy (4K thumbnails, better quality videos overall, video translation for bigger reach). The 20-30 minute range is where the signal concentrates for mid-size channels.
What Is the Optimal YouTube Video Length for Tech Reviews?
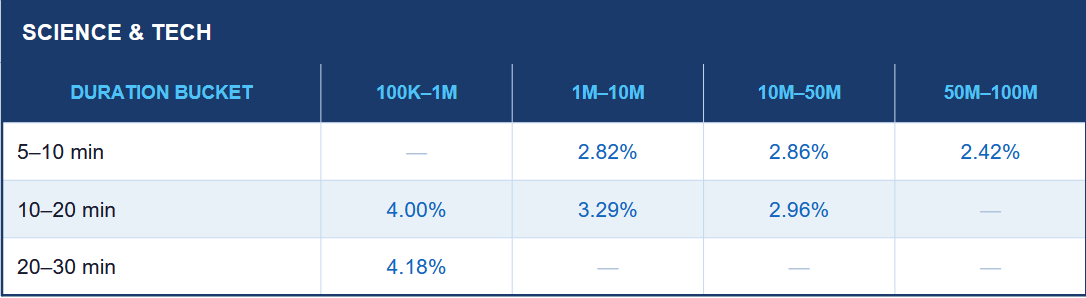
Science and tech channels show a similar trend because longer content wins here, too (across all tiers where data exists). At the 100K-1M tier: 20-30 min (4.18%) edges out 10-20 min (4.00%). Which is to say that both are strong, and the gap is smaller than in many other niches, but the direction still favors going longer.
- At the 1M-10M tier, 10-20 min (3.29%) clearly outperforms 5-10 min (2.82%).
- At the 10M-50M tier, 10-20 min (2.96%) beats 5-10 min (2.86%), a narrower gap, but still consistent.
- At the 50M-100M tier, only 5-10 min of data is available (2.42%), which reflects how the largest tech channels skew toward shorter, broader content for mass reach.
One pattern worth noting: the engagement decline from 100K-1M to 1M-10M in tech is among the more gradual in the dataset, from 4.00% to 3.29% for 10-20 min. This suggests that tech audiences remain relatively engaged even as channel size grows, which may show that the viewers follow specific creators for expertise first rather than personality.
For creators at any scale, consistently producing sub-10-minute tech content leaves meaningful engagement on the table compared to the 10-20 and 20-30 minute formats that top-performing channels in this niche favor.
That is to say, again, viewers who follow tech channels follow them for coverage most of all. When a channel signals that it’s moving toward shorter, punchier content (YouTube Shorts), that audience leaves. The same logic applies to video length within long-form: a 7-minute tech review that skips the real-world testing, the comparison would perform poorer than its counterpart that delves into all of these.
To demonstrate that tech audiences have high pre-existing intent when they seek out this content, let’s look into one of our partners’ cases. A tech channel with 1.5M monthly YouTube views added MSN distribution. As a result, in just 3 months: 7M views, 3.9M engaged views (56% engaged view rate), 20K+ likes, 4K comments.
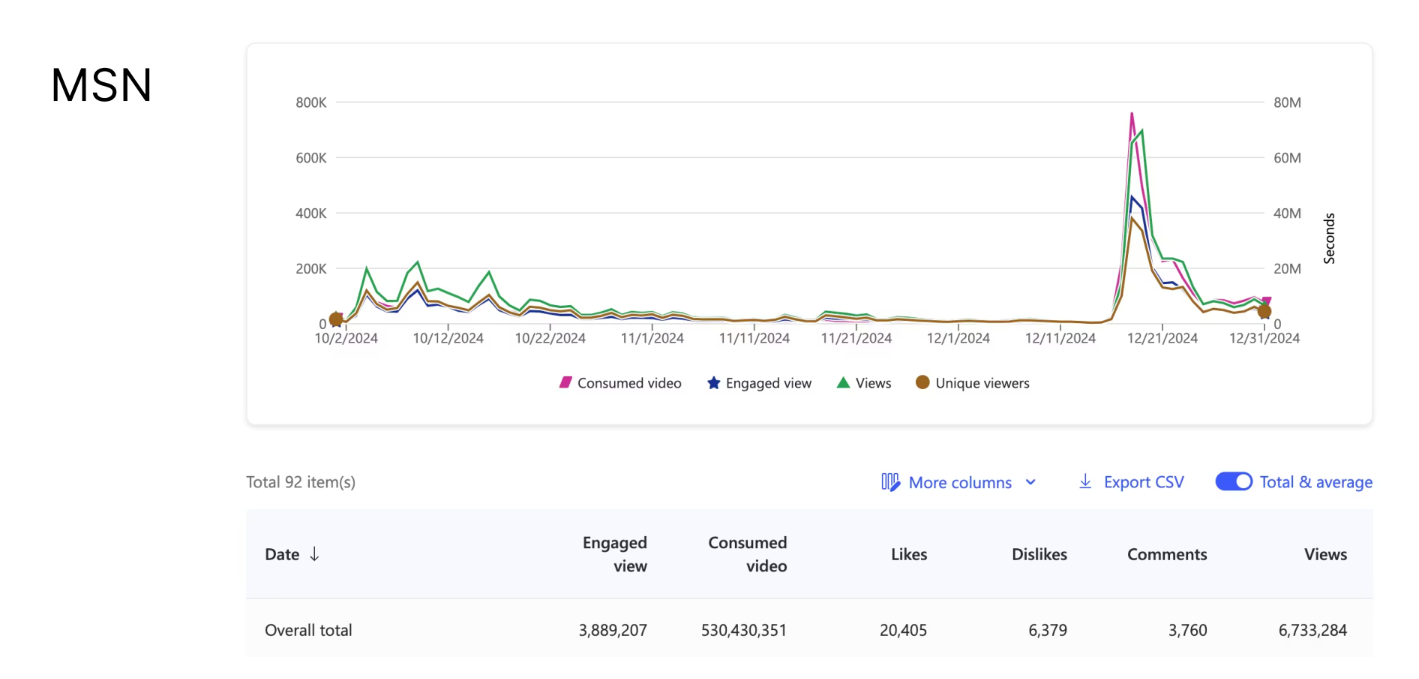
This proves that the intention produces growth for tech & science channels. Audience clicks because they want to know. That behavioral profile (intent-driven) is a part of why the 10-20 and 20-30 minute range outperforms short-form: a viewer who specifically searched for a product review or tech explainer is willing to spend time with it.
What Is the Best Video Length for Cooking Channels?
For cooking, data shows that the engagement rises with length as well.
- At the 100K-1M tier: 10-20 min (5.66%), 20-30 min (5.74%), 1-2hr (6.27%).
- At the 1M-10M tier, 10-20 min (2.82%) clearly outperforms 5-10 min (2.37%).
- At the 10M-50M tier, the gap widens further: 10-20 min at 2.71% vs 5-10 min at only 1.47%, a 1.24% point spread, among the larger absolute gaps in the dataset at that tier.
- At the 50M-100M tier, 1-2hr content (2.82%) actually leads over 10-20 min (2.01%) and 5-10 min (1.74%), suggesting that at the largest scale, cooking audiences self-select strongly toward very committed viewers who watch longer sessions.
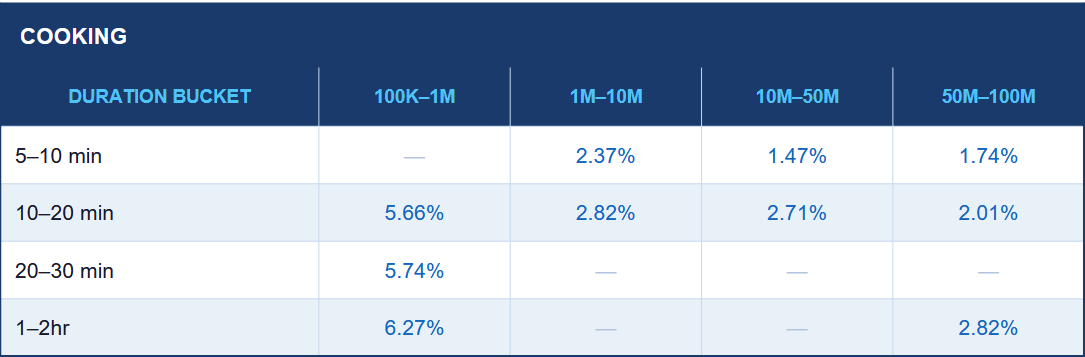
For most cooking creators, the data consistently shows that going below 10 minutes costs significant engagement across all four channel tiers, and that the 20-30 minute range outperforms 10-20 minutes where data allows the comparison.
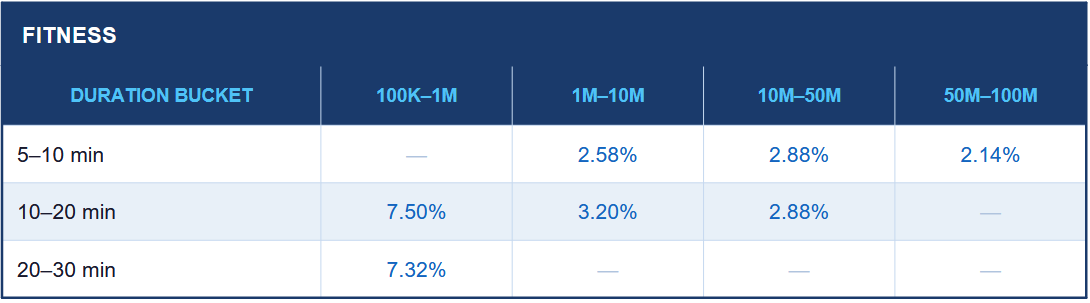
How Long Should Fitness YouTube Videos Be?
Fitness is the highest-engagement niche in the dataset for standard long-form video.
- At the 100K-1M tier, 10-20 min reaches 7.50%, and 20-30 min holds nearly as strongly at 7.32%. These are the top two figures in the study for any niche at that tier outside Business/Finance's 1-2hr outlier.
- The drop-off to 5-10 min content is dramatic: at the 1M-10M tier, 10-20 min produces 3.20% vs 2.58% for 5-10 min.
- At the 10M-50M tier, the 5-10 min and 10-20 min buckets show identical engagement (2.88% each), the length differentiation flattens at large scale, likely because mass-reach fitness channels attract casual browsers alongside committed fitness audiences.
- At the 50M-100M tier, only 5-10 min data is available (2.14%).
The pattern across all four tiers: fitness content at 10-20 min consistently meets or exceeds shorter formats in engagement, and at smaller scales, the advantage is very large. The 20-30 min figure at the 100K-1M tier (7.32%) tells creators that going above 20 minutes doesn't hurt in this niche, because longer routines and multi-part training sessions hold audience attention at small-to-mid scale.
The Health & Fitness niche is the strongest when it comes to combining long and short form content. It’s the opposite of gaming. The recommended Short ratio for fitness is ~37% of uploads, which is roughly 1 Short per 2 long-form videos.
Want your channel to grow faster?
The answers are in your data. We have a team of 200+ analysts and 21 AI diagnostic tools to find them.
Find what's holding you backWhat Is the Ideal Video Length for Beauty and Makeup Content?
Beauty delivers the highest single-bucket figure in the dataset at the 100K-1M tier: 10-20 min at 7.87%. From there, the engagement curve drops to 5.61% at 20-30 min, then shows a partial recovery at 30-40 min (4.90%) before falling again at 40-50 min (3.94%). The 2hr+ bucket at the 100K-1M tier reads 4.45%, and the 1M-10M 1-2hr bucket reads 3.65%, both above the shorter formats at their respective tiers, which tells an interesting story about how committed beauty viewers behave.
- At the 1M-10M tier, 10-20 min (2.92%) clearly leads 5-10 min (1.69%).
- The 1-2hr category at that tier (3.65%) is actually the highest figure for any bucket, which suggests that beauty audiences are willing to commit to very long tutorials and are disproportionately engaged, even if they're a smaller fraction of total viewers.
- At the 10M-50M tier, 3-6 min (2.41%) and 5-10 min (1.97%) are the only buckets with data, and 30-40 min drops to 0.90%, which shows that at a large scale, short-form beauty content performs reasonably, very long-form loses audience fast.
- At the 50M-100M tier, only 5-10 min data exists (1.63%).
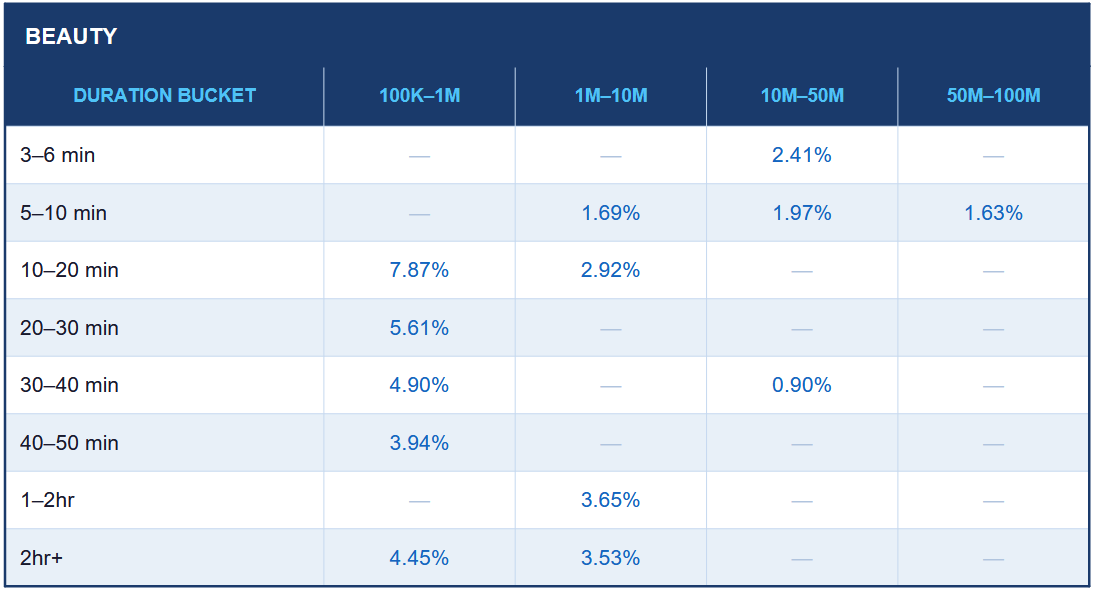
As a result, for most beauty creators, 10-20 minutes is the clearest engagement peak, and it holds well at 100K-1M and 1M-10M tiers. The 30-40 min secondary peak at smaller scales is real but applies to specific formats, aka full glam tutorials, multi-product comparisons, and the works, rather than most content types.
What Is the Optimal Video Length for Travel Vlog YouTube Channels?
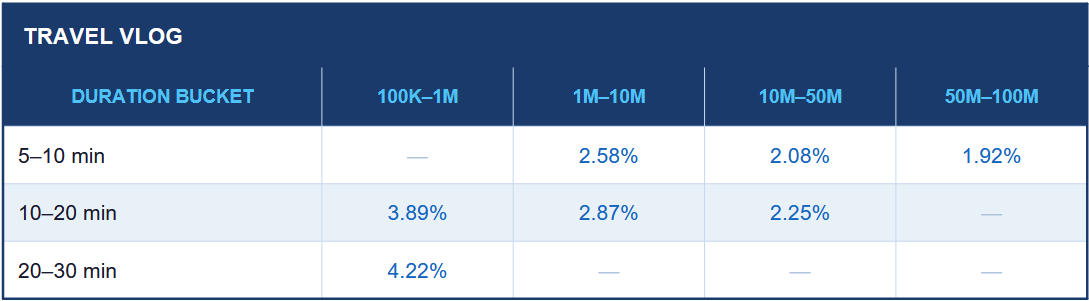
Another set of rather straightforward and consistent patterns across all four tiers can be found in travel vlog YouTube channels. Longer beats shorter at every scale where data allows comparison. You can see it on the graph.
- At the 100K-1M tier: 20-30 min (4.22%) leads 10-20 min (3.89%).
- At the 1M-10M tier: 10-20 min (2.87%) leads 5-10 min (2.58%).
- At the 10M-50M tier: 10-20 min (2.25%) leads 5-10 min (2.08%).
- At the 50M-100M tier, only 5-10 min data exists (1.92%).
The engagement decline from 100K-1M to 50M-100M is among the more gradual in the dataset for travel: from a 4.22% peak to 1.92% at the shortest available bucket at the largest tier. Travel audiences keep that relatively strong engagement loyalty across scale compared to entertainment or gaming.
The views-per-subscriber ratio for travel channels is among the lower figures across niches, reflecting the destination-specific and search-driven nature of travel content. Not every subscriber watches every video, because travel audiences follow for specific locations or trip styles.
Travel vlogs and adjacent content thrive on longer, more adventurous, and dedicated content. Therefore, the practical advice would be to put your bets on longer videos (20-30 minutes). Moreover, to increase overall viewership and engagement, you could optimize for TV viewership, of course, but you could take it a step further with localization, just like our partner, Brave Wilderness, did.
Most channels with 500K+ subscribers skip dubbing, missing out on multiplying their revenue. Our localization for Brave Wilderness brought them over 27M extra views. That’s the result of YouTube-specific localization. Want to know how it’s done?→ Reach your international audience
What is the Best YouTube Video Length for DIY and How-To Videos?
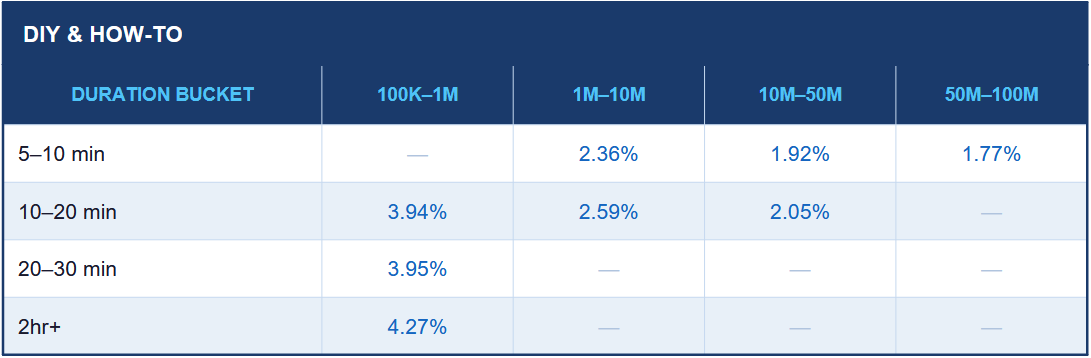
DIY and how-to channels show similar engagement patterns across 10-20 min (3.94%), 20-30 min (3.95%), and 2hr+ (4.27%) at the 100K-1M tier. The near-identical figures for 10-20 min and 20-30 min mean that creators who need more time to cover a full project aren't penalized for going longer, and the 2hr+ figure shows the ceiling is higher still for very extended project content.
- At the 1M-10M tier: 10-20 min (2.59%) leads 5-10 min (2.36%).
- At the 10M-50M tier: 10-20 min (2.05%) leads 5-10 min (1.92%).
- At the 50M-100M tier, only 5-10 min data exists (1.77%).
As we can see, the consistent length advantage in DIY holds across every tier where comparison is possible.
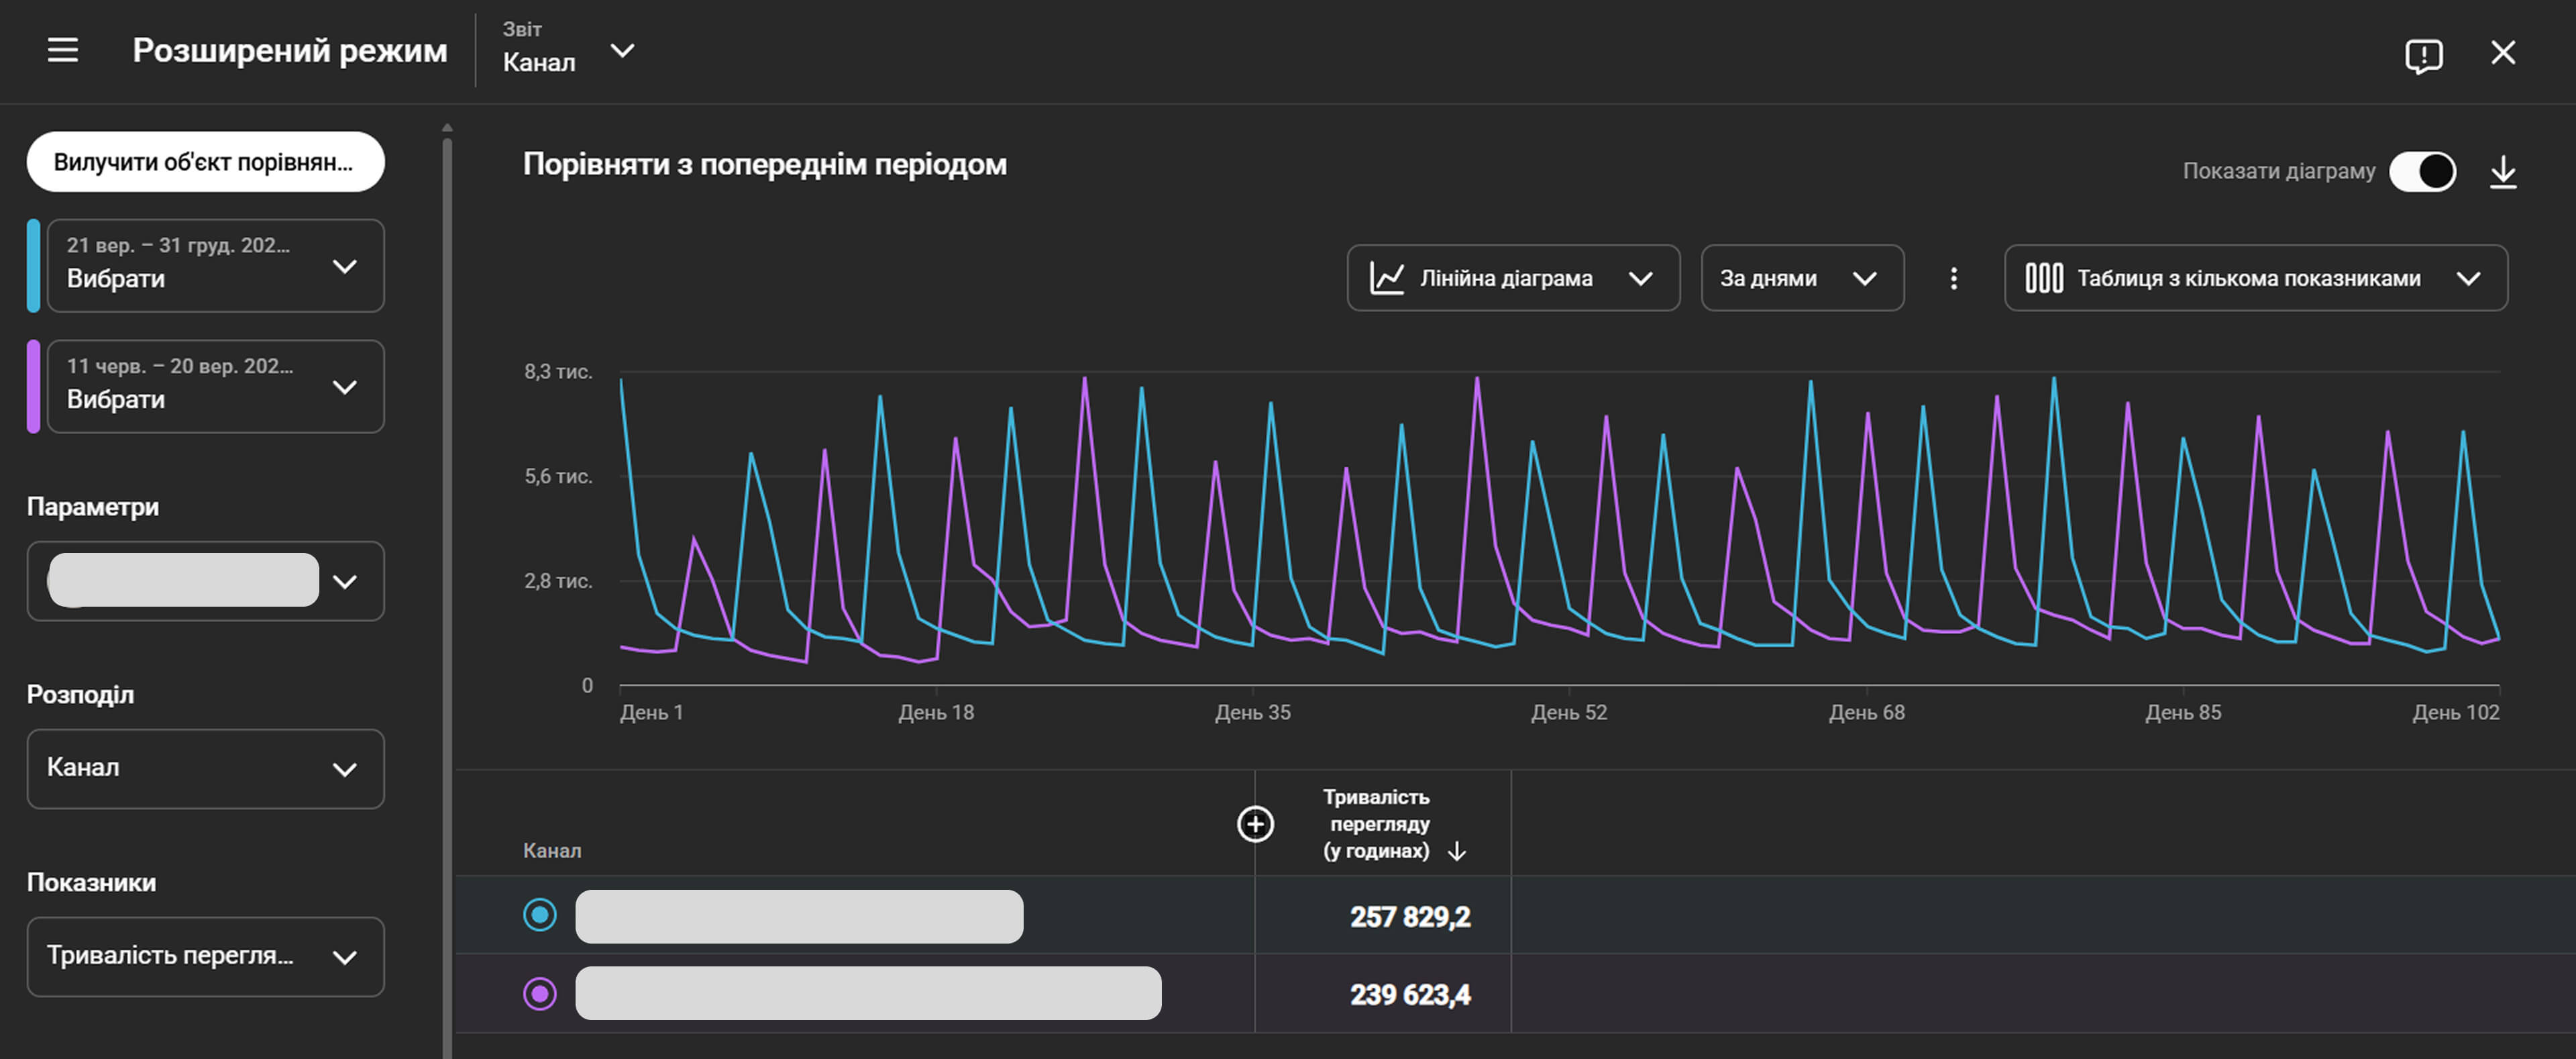
Now, let’s back up the statistics with real channel data. One of our partners, a DIY channel, increased average video length from 20-25 minutes to 25-30+ minutes. Despite a 9% view decline from a platform-wide traffic slowdown, revenue grew 20%. Watch time hours climbed from 239,623 to 257,829 (up 7.6%), and those extra 18,206 hours of watch time drove that additional revenue.
What Is the Ideal Video Length for Business and Finance YouTube Channels?
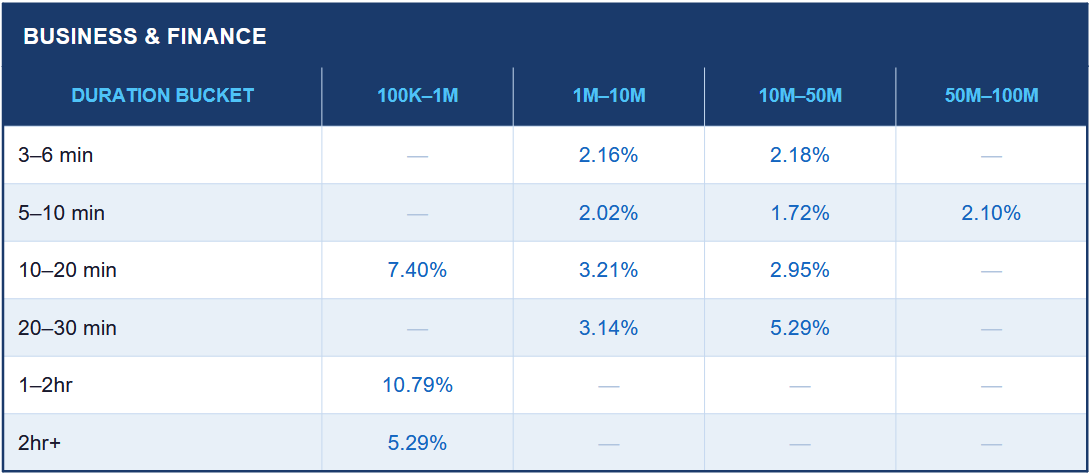
There’s an interesting statistic in the business and finance content, which contains the most striking data point in the entire study: 1-2hr content in the 100K-1M tier reaches 10.79% engagement. That's 46% higher than the next-best bucket at that tier (10-20 min at 7.40%), and it's roughly five times the engagement of short-form business content at the 1M-10M tier. The 2hr+ bucket in the 100K-1M tier (5.29%) also outperforms the peak figures of most other niches.
- At the 1M-10M tier: 10-20 min (3.21%) leads, 20-30 min (3.14%), 3-6 min (2.16%), and 5-10 min (2.02%).
- The difference between 10-20 min and 5-10 min at this tier (3.21% vs 2.02%) is among the larger absolute gaps in the dataset. Which means that a business creator consistently publishing 7-minute explainers is getting roughly 63% of the engagement of one producing 12-minute videos on similar topics.
- At the 10M-50M tier, the most striking figure is the 20-30 min bucket: 5.29%, which is the same as the 2hr+ figure at the 100K-1M tier, and almost double the 10-20 min figure at that same tier (2.95%). This, in turn, suggests that at a large scale, the viewers prefer to engage casually with shorter content, but those who click on a 25-minute video are highly committed viewers.
- At the 50M-100M tier, only 5-10 min data exists (2.10%), which is consistent with the pattern of the largest channels skewing toward shorter formats for broad reach.
How Long Should Entertainment YouTube Videos Be?
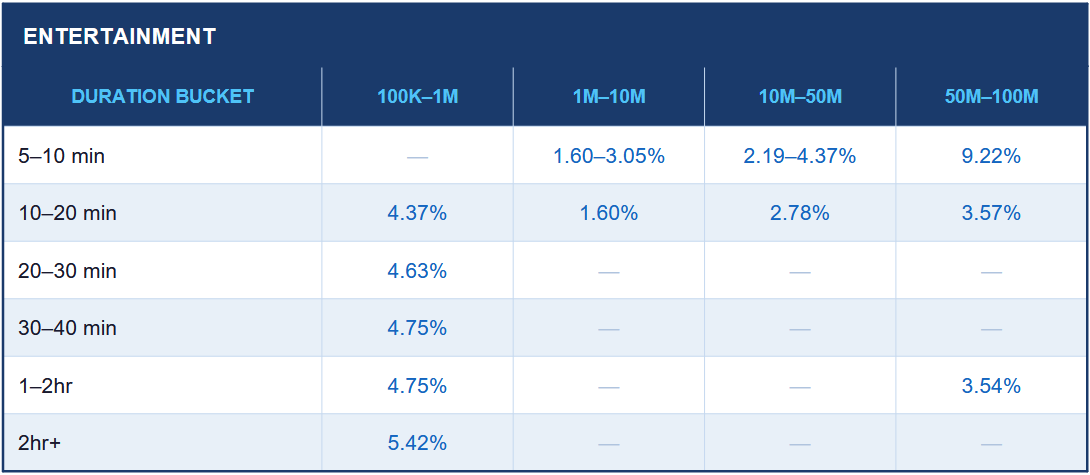
Entertainment channels show engagement rising with video length at the 100K-1M tier: 10-20 min (4.37%), 20-30 min (4.63%), 30-40 min (4.75%), 1-2hr (4.75%), and 2hr+ (5.42%). The direction is unambiguous for smaller channels.
- At the 1M-10M tier, the picture is more complex. Two rows in the dataset show 5-10 min at 1.60% and 3.05%, respectively, likely reflecting sub-genre differences within entertainment at that scale (short viral clip channels vs. longer commentary or challenge formats). The 10-20 min bucket shows 1.60% at this tier, near the lower end of the 5-10 min range.
- At the 10M-50M tier, multiple 5-10 min rows show engagement ranging from 2.19% to 4.37%, while 10-20 min reads 2.78%. Again, internal sub-genre variance within entertainment on a large scale makes clean comparisons harder than in more defined niches.
The most notable figure in the dataset for this niche is the 50M-100M 5-10 min reading: 9.22%. This is the highest single engagement figure in the entire study at any tier. It almost certainly reflects a specific type of mass-reach entertainment channel (viral short-clip compilations or meme-adjacent content) where the 5-10 minute window coincides with extremely high-engagement content.
For most entertainment creators not in that specific sub-format, the best would be reaching for the peak at 5.42% for 2hr+ at 100K-1M.
One real-world example is an entertainment channel that we have already helped, which is in a chat roulette format.
- Problem: videos ranging from 1 to 20 minutes, average ~10 minutes, (inconsistent)
- Change: standardized to a 10-15 minute window starting September 2025
- Average video length: 10:04 → 12:35 (+25%, +2 min 31 sec)
- Average view duration: 5:39 → 7:21 (+30%, +1 min 42 sec)
- Avg watch hours per video: 1,514 → 1,744 hours (+15%)
The gain here came from both the length increase (which brings more space for mid-rolls) and format consistency (YouTube algorithm loves predictability). You can’t just win by picking one over the other.
What Is the Optimal Video Length for Kids' YouTube Channels?
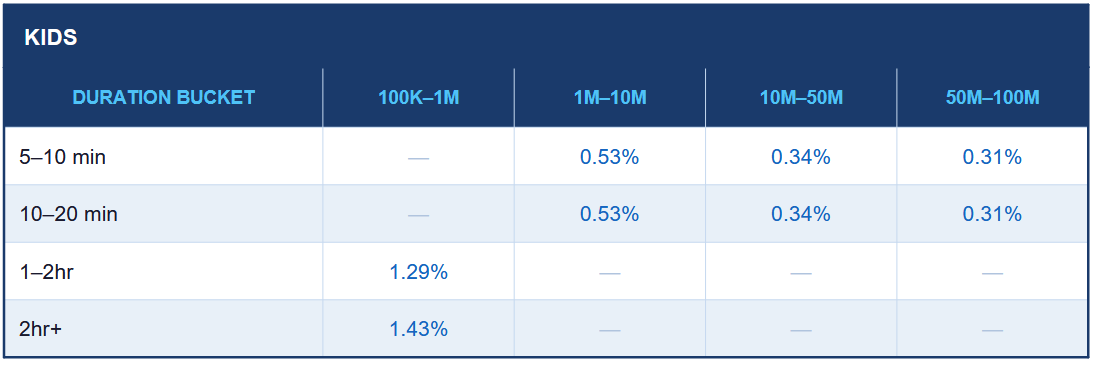
Now, kids’ content is an interesting topic because it has the lowest engagement rates in the dataset across all tiers. That’s not necessarily a bad thing, too. Kids’ content usually resides in YouTube Kids, where the comments are disabled and, therefore, the engagement can be lower on paper, while the audience is actually one of the most highly engaged on the platform.
With that being said, at the 1M-10M tier, both 5-10 min and 10-20 min produce 0.53%, identical. At the 10M-50M tier, both produce 0.34%. At the 50M-100M tier, both produce 0.31%. Length makes no measurable difference to engagement in kids' content at scale.
The 100K-1M tier is the exception: 1-2hr content reads 1.29%, and 2hr+ reads 1.43%, which is higher than any other length at any tier in the kids data. This is likely a trend of some kids watching longer, compilation-style content, or full-on episodes of YouTube-produced shows. Oftentimes, such things are watched by parents alongside their kids. And, more often than not, it happens on big TV screens.
The flat engagement across lengths at every tier from 1M to 10M and upward is structural. Engagement rate is the wrong metric to optimize for in this niche.
The correct, or rather, more relevant metrics for kids’ channels are audience retention (what percentage of the video gets watched) and views-per-subscriber (how reliably the existing audience returns). On retention, shorter videos consistently outperform longer ones in kids’ content.
A real example would be the kids' compilation channel case in our partner portfolio that switched from 28+ minute compilations to shorter formats. Average percentage viewed jumped from 8-12% to 16-22%, and recommendation traffic share grew from 67.3% to 75% of all views. While the engagement rate didn’t move, the distribution improved because the retention quality improved.
- Problem: 28+ minute compilations with APV of only 8–12%
- Recommendation traffic before: 12-16% of views
- APV: 8–12% → 16.4–22% (roughly doubled)
- Recommendation traffic share: 67.3% → 75%
- Avoided the seasonal September dip entirely (prior year had a clear drop)
- Short videos: 8.8% recommendation traffic vs 6.8% for long videos
- Overall recommendation share: 70.8% → 74.2%
The core principle here is that the optimal length for your content is determined by the content’s natural retention ceiling. 28 minutes is beyond what that channel’s content could hold.
Key Takeaways For Creators
- The optimal length varies by niche, and the gaps are large. Beauty peaks at 10–20 min (7.87%). Business 1–2hr reaches 10.79%. Kids show no meaningful engagement difference across any length, because that metric is not applicable for that type of content.
- The 5-10 minute range is overcrowded. It's the most common format in every niche by video count. It's not the highest-engagement format in any niche at the 100K-1M or 1M-10M tier. Creators defaulting to sub-10-minute formats because they feel safer are competing in the most crowded window with below-average engagement returns.
- Business and fitness creators benefit most from going longer. These are the two highest-engagement niches in the study, and both reward longer formats significantly over 5-10 minute ones at every tier where data allows comparison. The business 1-2hr format at a smaller scale (10.79%) is a category of its own; it's the data point in this study that should make deep-dive creators rethink short-form instincts.
- Channel size shapes the optimal length. The patterns are strongest at the 100K-1M tier and compress as channel size grows. The engagement ceiling at 50M-100M is lower across all niches, and the length advantage tends to narrow, though it doesn't disappear in most niches. A 100K-subscriber channel and a 10M-subscriber channel in the same niche aren't playing the same game.
- Kids' channels should optimize for retention, not engagement rate. Engagement rate is flat across all lengths at every scale in kids' content. The metric that actually drives distribution in this niche is audience retention percentage, and that responds better to shorter formats. The engagement table for kids is nearly useless as an optimization target; the retention and recommendation data tell the real story.
Knowing Is Half the Battle. What Is the Next Step?
The patterns above cover 18,080 channels across four size tiers. Your channel is one channel — with its own niche positioning, current retention curve, traffic source split, and history. Knowing the benchmark for your niche and size tier doesn't tell you where you currently sit against it.
Every channel has at least two structural problems invisible from the inside. Sometimes it's the video length. More often, it's packaging, traffic routing, or format mix. The data tells you what high-performing channels do. It can't tell you what yours is doing wrong.
That's what the AIR Expert Audit does. Our team of 200+ strategists — backed by deep Studio access to 3,000+ channels, a 450K-channel training dataset, 1 trillion views analyzed, and 21 in-house AI diagnostic tools — dissects your channel across 10 angles and hands you a plan that's specific to your situation, not a generic checklist.
What you get:
- A structured report across 10 performance pillars: packaging, retention, traffic sources, competitor gaps, format mix, revenue structure, audience behavior, risk signals, growth projection, and a ranked roadmap
- A 30-day action plan ranked by impact — what to change first, and what number each move should move
- A 45–60-minute live walkthrough with your senior AIR strategist to unpack the findings and answer every question


