


Two channels can have the same number of subscribers and live in completely different financial realities. One struggles to cross $1K a month. The other pulls $10K, $20K, or more. The AIR team decided to investigate the issue. We looked past subscriber count and broke the channels down by structure: content library, video length, upload frequency, monetization layers, localization, and traffic quality.
We analyzed three sets of channels with the same number of subscribers.
Here’s what we got.
The Short Answers First
Before we get into the cases, here are the answers to the questions we get most often. The full data is below.
Why Do Two YouTube Channels With the Same Subscribers Earn Differently?
Because subscribers measure audience size, not monetization architecture. Revenue depends on video length, library size, language markets, active monetization layers like Memberships and live streams, and how well the channel is optimized for discovery. Two channels at 450K subscribers can earn $1K and $10K a month simultaneously, not because one is more popular, but because one is built better for revenue. More on that below.
What Determines How Much a YouTube Channel Earns?
Five things, in roughly this order of impact:
- Video length. Videos under 8 minutes earn no mid-roll ads.
- Library depth. More videos mean more surface area for YouTube to monetize every day.
- Geography. The same view from Switzerland is worth 10x more than one from Colombia
- Monetization layers. Memberships, live streams, and dubbed tracks stack on top of ad revenue
- Content format. Shorts bring reach but almost no revenue density compared to long-form.
Does Subscriber Count Predict YouTube Revenue?
No. Subscriber count is a distribution metric, not a revenue metric. The channels in this article have identical subscriber counts and earn between 3x and 13x different amounts. What predicts revenue is how the channel is structured to monetize the views it already gets.
How Do I Increase My YouTube RPM?
The fastest levers: make videos longer than 8 minutes to unlock mid-rolls, localize metadata and audio into high-CPM language markets like Germany, France, or Canada, fix any yellow-icon monetization restrictions on existing videos, and add a Membership offer if you have a loyal audience. Each of these is documented in the case studies below.
Case Study #1: Two 450K Channels, $1K vs $10K
Two AIR partner channels. Similar subscriber base. Very different monthly revenue.
Channel A is a fitness channel. Channel B is a documentary channel.
→ Channel A averages about $1K/month
→ Channel B averages about $10K/month
On the surface, both channels sit around the same size: roughly 450K subscribers each. But once you break down how they generate revenue, they are built in completely different ways.
The structural breakdown:
|
Metric |
Channel A |
Channel B |
|
Subscribers |
~450K |
~450K |
|
Monthly revenue |
~$1K |
~$10K |
|
Total videos |
221 |
2,009 |
|
Avg. video length |
2 minutes |
16 minutes |
|
Upload frequency |
2 per month |
1 per week |
|
Niche |
Fitness |
Documentaries |
|
Main growth lever |
Membership relaunch |
Auto-dubbing / translated discovery |
|
Revenue core |
Memberships |
Scaled ad/view monetization |
|
Translated view growth |
Not utilized |
+420% quarter over quarter |
So, why is the gap so big? Let's figure it out.
These Channels Are Monetizing Different Things
Channel A is monetizing a community.
Channel B is monetizing a library.
That difference matters immediately.
On Channel A, we can see that the channel’s big lift came after the AIR team helped relaunch Memberships in March 2024.
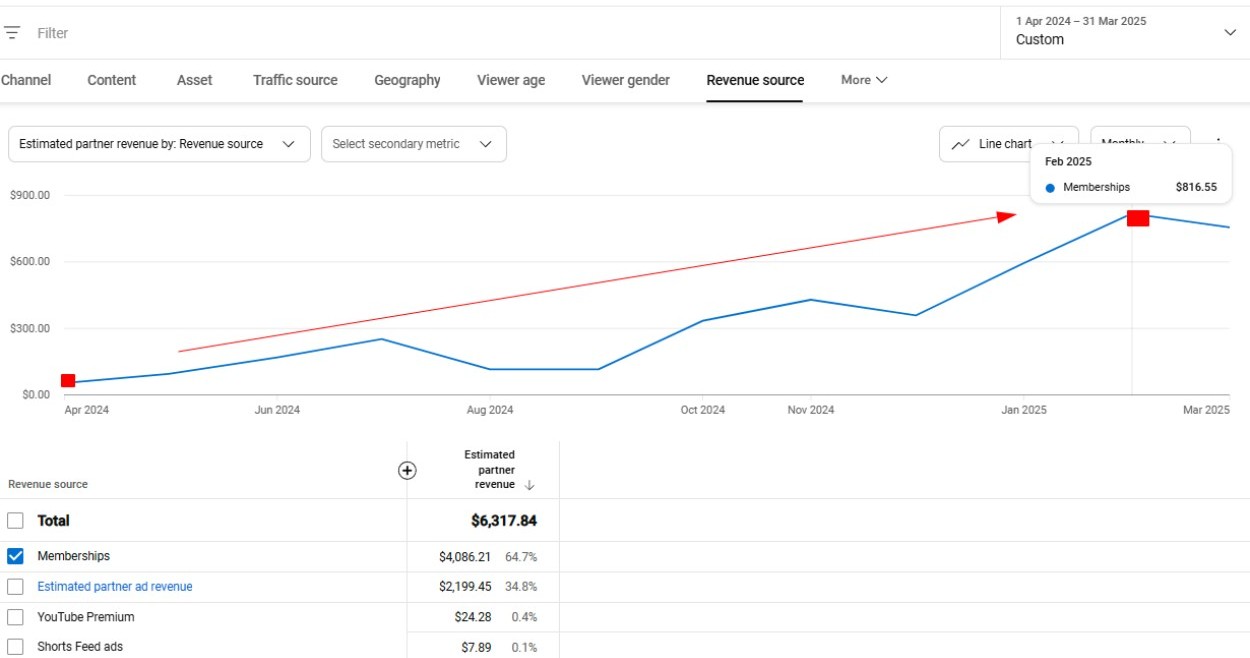
Before that, the feature had been largely ignored for years and was bringing in only about $50/month on average. After the relaunch, the channel saw a 16x increase in stable monthly income from Memberships and a 9x increase in the number of members. The channel now gets almost 80% of its income from Memberships, which is about 4x more than ad revenue.
Over the last 12 months, Memberships generated $4,086.21, or 64.7% of total partner revenue, while standard ad revenue brought $2,199.45, or 34.8%. In March 2025 alone, total channel revenue was $959.79, and $754.94 of that — 78.7% — came from Memberships. That means the channel is a membership business with ads on top.
By contrast, Channel B is built around view-driven monetization at scale: long videos, a huge archive, regular publishing, and a growing translated audience layer on top of a large base of total views.
Library Depth Changes the Whole Revenue Ceiling
This is probably the single biggest structural difference:
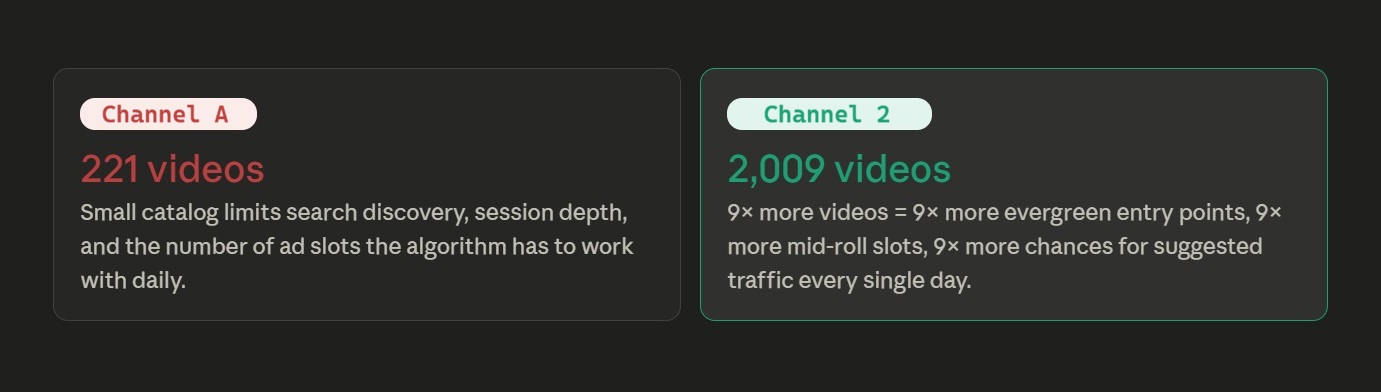
That is not a small gap. It is a 9x bigger content library.
A large archive means:
- more searchable entry points
- more suggested-video opportunities
- more evergreen traffic
- more monetizable impressions every day
- more chances for old videos to keep earning long after upload
In other words, Channel B has far more surface area for YouTube to monetize.
And because the channel publishes weekly and already has thousands of assets, translation does not have to carry the whole business by itself. It only needs to improve distribution. Once translated, viewers enter the system, and there is already a deep catalog to keep them watching.
Channel A does not have that same compounding inventory. A 221-video library is respectable, but it cannot produce the same ongoing ad footprint as a 2,009-video archive.
Video Length Changes Revenue Density
This is another major difference.
- Channel A: 2-minute average video length
- Channel B: 16-minute average video length
That is an enormous monetization difference.
Videos under 8 minutes get zero mid-roll ads. At 2 minutes, Channel A earns only a pre-roll impression at the lowest possible RPM. Channel B's 16-minute videos trigger multiple mid-roll slots (each one worth $3–$12 RPM), turning every view into a compounding ad session.
Shorter videos can still work well for views, but they offer much less room for:
- longer session time
- mid-roll inventory
- deeper watch time accumulation
- algorithmic compounding through longer viewer journeys
Meanwhile, 16-minute videos give YouTube much more monetizable watch time per viewer and much more room for long-form recommendation momentum.
So, even before translation enters the picture, Channel B is structurally better built for ad revenue.
Channel B Became International
We helped the channel to set automatic dubbing. At first, the results were weak. But over the quarter, the translated-view layer started accelerating. Compared with the previous quarter, translated views grew by 420%, from about 54K to about 282K.
That growth is visible in the screenshot:
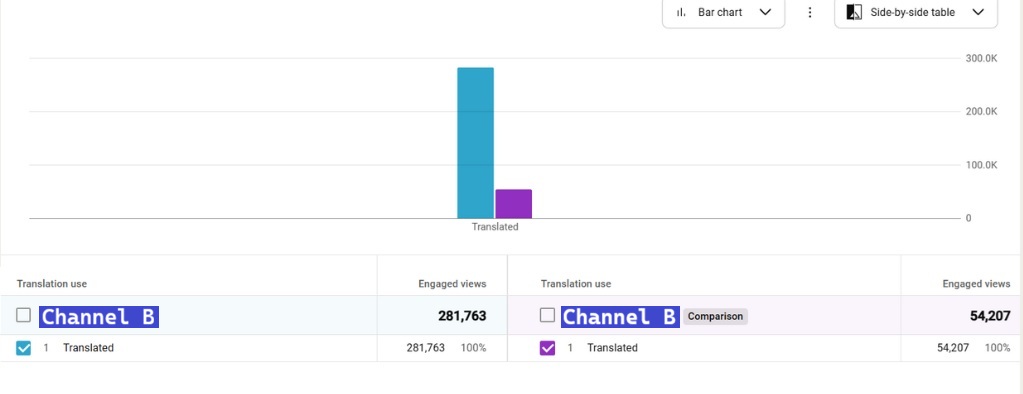
We can clearly see:
- 54,207 engaged translated views in the earlier comparison period
- 281,763 engaged translated views in the latter one
Translated performance reaching about:
- 308,912 views
- 24,109.5 hours of watch time
- 4:40 average view duration
And importantly, translated viewers are not watching less. In another screenshot, translated videos show 4:36 AVD, compared with 4:19 on original-language views. That suggests the translated layer is bringing viewers who are at least as engaged, and in that view, it is actually outperforming the original-language average.
That is exactly the kind of signal YouTube can scale.
Translation is Opening Better Geography for Channel B
Top countries in the translated-view layer include:
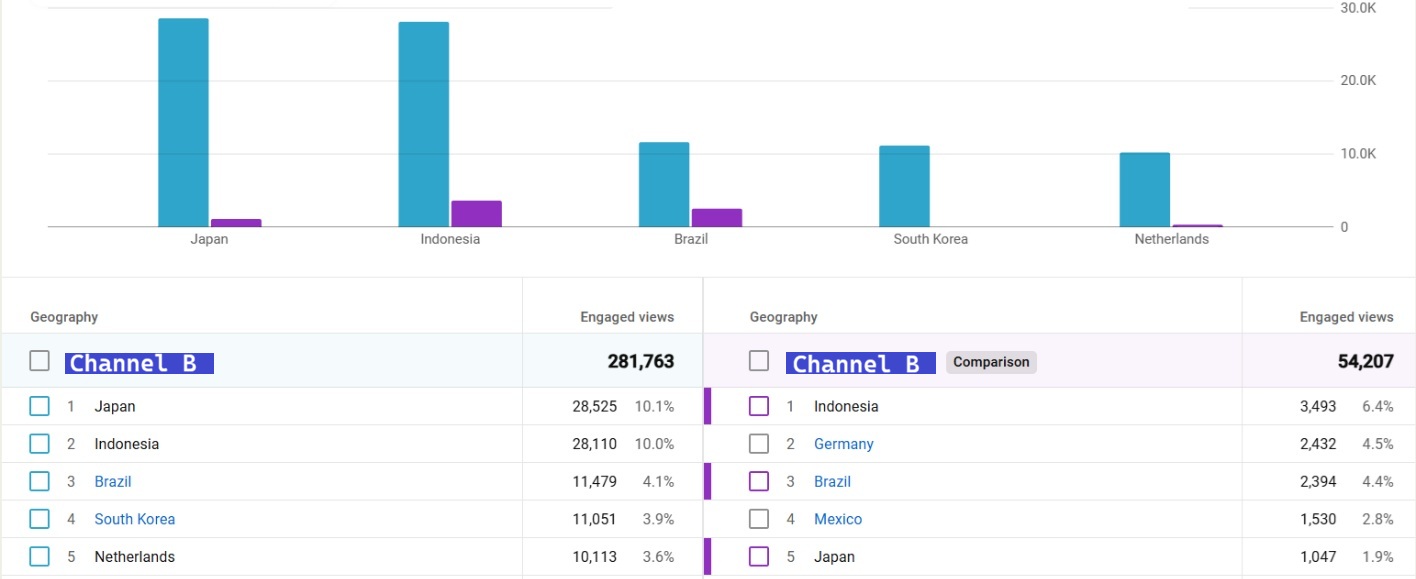
The “after” side is led by:
- Japan (CPM:$5.68) — 28,525 engaged views
- Indonesia (CPM:$0.84) — 28,110 engaged views
- Brazil (CPM:$1,64) — 11,479 engaged views
- South Korea (CPM:$5.73) — 11,051 engaged views
- Netherlands (CPM:$8.62) — 10,113 engaged views
That country mix matters because it shows the channel is no longer relying only on its original market. Translation is helping it unlock new demand pools. Even if some of those geographies are not the absolute highest CPM markets individually, together they broaden the channel’s monetization base and reduce dependence on one language ecosystem.
That is a very different engine from Channel A.
Channel A’s Revenue is More Stable, but Its Ceiling is Narrower
This is important because the first channel is not “worse.” It is simply built around a different monetization lever.
AIR’s recommendations on Channel A worked because they improved Membership economics, not because they tried to turn the channel into an ad-scale machine. The bonuses were strong and specific:
- exclusive longer training videos
- private communication with the creators on live streams
- a separate members-only chat
- personalized recommendations
And the Membership feature was promoted properly:
- JOIN widget on the homepage
- members-only video widget on the homepage
- bonus promotion in community posts
- membership link in video descriptions
That is a good monetization structure for a highly engaged audience. It creates stable, recurring revenue and is much less dependent on algorithmic traffic swings.
But it also means the channel’s income is tied to:
- how many people convert
- how valuable the perks feel
- how actively the feature is promoted
In March 2025, the channel got 76 Membership transactions, generating $754.94. That is an excellent conversion value for the channel size, but it is still fundamentally a smaller-scale engine than 2,000 long-form videos monetized through discovery and international growth.
How Can You Earn More Based on Case Study #1?
The core lesson to grow a YouTube revenue here is that revenue architecture matters more than subscriber count. These two channels prove you can build completely different businesses on the same audience size, and that the decisions driving the gap have nothing to do with content quality or upload consistency.
The Membership story is worth paying attention to regardless of your niche. Channel A had the feature enabled for years and averaged $50 a month from it. After relaunching it with real exclusive perks and promoting it properly, it hit $754 in a single month, without adding a single subscriber.
The video length and library depth data from Channel B are equally direct. Videos under 8 minutes earn zero mid-roll ads — one pre-roll at minimum RPM is the ceiling. Channel B's 16-minute average triggers multiple mid-roll slots per view at $3–$12 RPM each, which compounds across a 2,009-video archive generating traffic every single day. A deep library earns while you sleep. A thin one stops earning the moment you stop uploading.
Translation ties both models together. Channel B's translated layer grew 420% in one quarter, and translated viewers watched longer than original-language ones. That is the signal YouTube scales: engaged views from new geographies, including higher-CPM markets that the channel had no presence in before.
The practical takeaways:
- Videos under 8 minutes are structurally capped on ad revenue. Two extra minutes can change that.
- Memberships fail when the perks aren't exclusive, and the feature isn't visible. Exclusive content, direct creator access, and personalized interaction convert.
- Every video in your archive is a long-term monetization asset. The compounding value of a large library is real and significant.
- Translated views can outperform original-language ones in both engagement and CPM. The market you are in matters as much as the views you get.
- A channel earning 90% from ads is one algorithm shift away from a difficult month. Layering Memberships, dubbed audio tracks, or live streams on top changes that risk profile.
A Quick Case Study #1 Self-Check
- Are your videos consistently over 8 minutes? If not, mid-roll ads are structurally unavailable to you, regardless of how many views you get.
- Do you have Memberships enabled, and are they promoted actively — in video descriptions, in community posts, and with a visible widget on your homepage? Enabled is not the same as promoted.
- Do your Membership perks offer something a free subscriber genuinely cannot get elsewhere on your channel? Exclusive content, direct creator access, and personalized interaction convert. Badges and emojis alone usually do not.
- When did you last review or refresh your Membership offer? A stale tier that has not changed in a year is losing members quietly.
- How many long-form videos are in your archive? The compounding value of a content library requires a real library to compound from. Under 100 videos is a thin base.
- Have you checked your older videos' metadata recently? A title and description refresh on a 2-year-old video can signal YouTube to surface it again.
- Have you tested auto-dubbing into even one high-CPM language market? The setup is minimal. The translated view data it generates (average view duration, geographic engagement, and whether retention matches your originals) tells you whether scaling it makes sense for your channel specifically.
- Is your revenue coming from more than one source? A channel earning 90% from ads is one algorithm shift away from a difficult month. Memberships, dubbed audio tracks, and live streams each add a layer that does not depend on the same variables.
Wondering what your channel is actually built to earn?
Subscriber count rarely tells the full story, but a proper breakdown of monetization layers, content structure, and revenue leaks does. Contact us , and we’ll show you where your real growth potential is hiding.
Now we know how channels in different niches and with very different revenue operate. Let’s dissect the pair in the same niche and with more similar earnings.
Case Study #2: Two News Channels, 2.2M Subs Each, $25K vs $21K
Same niche. Almost the same subscriber base. Different monetization architecture.
→ Channel C averages about $25K/month
→ Channel D averages about $21K/month
At first glance, the gap does not look dramatic. But once you break down how each channel earns, it becomes clear that these are two very different businesses.
One is built like a high-volume monetization machine. The other is built like a high-growth international discovery engine.
Here’s the structural breakdown:
|
Metric |
Channel C |
Channel D |
|
Niche |
News |
News |
|
Subscribers |
2.2M |
2.2M |
|
Monthly revenue |
~$25K |
~$21K |
|
Avg. video length |
16 min |
12 min |
|
Upload frequency |
~47 uploads/week |
~2 uploads/week |
|
Total videos |
16K |
4.1K |
|
Main language setup |
Arabic + auto-dubbed English |
English + auto-dubbed into 18 languages |
|
Main growth lever |
Monetization recovery + 24/7 streams + Memberships |
Metadata localization + translated discovery |
Let’s look at why Channel C earns more:
Channel C Has a Much Larger Monetization Surface
This is the biggest structural difference.
- Channel C: 16,000 videos
- Channel D: 4,100 videos
That is nearly a 4x larger library.
A news channel with 16K videos has:
- more searchable entry points
- more suggested-video inventory
- more monetizable long-form assets
- more old videos still earning in the background
- more material to repackage into streams and sessions
That kind of library creates a base layer of monetization that does not depend on one good month or one big topic spike.
Channel D’s archive is still large, but Channel C simply has much more surface area for ads.
Channel C Publishes at a Completely Different Speed
The gap here is massive:
- Channel C: about 47 uploads per week
- Channel D: about 2 uploads per week
That means Channel C is constantly feeding the algorithm with fresh inventory, while Channel D is much more selective and event-driven.
In news, publishing speed matters because fresh videos capture trending search and browse demand, more uploads create more monetizable impressions, and higher publishing frequency keeps viewers in a habitual session loop.
That high upload cadence works for Channel C because the content is real, unique, and human-driven. News requires genuine editorial judgment on every upload. That human touch is what makes the volume sustainable.
What Changed About Posting Frequency in 2026?
But posting frequency is not a lever you can push without limits, especially in 2026. If your channel runs on full AI production with no human involvement, posting 12 or more times a day is one of the clearest signals YouTube uses to detect artificial channel behavior — and act on it.
YouTube is not against AI tools. They are against the absence of human touch.
Since the AI wave began, thousands of creators started generating entire farms of content: thousands of videos, no one behind them. For a while, YouTube let it slide. But in July 2025, the cleanup began. The major wave hit in January 2026, when channels earning ten million dollars a year disappeared overnight. YouTube detected the farms. Cut them off.
YouTube now detects AI-driven channels at three levels:
- Level 1 — AI encoding. Tools like Sora, Runway, and Midjourney embed metadata in the file that flags its AI origin. Pure AI content gets flagged automatically.
- Level 2 — video and audio signals. YouTube scans for unnatural patterns in deepfake detection, robotic rhythm, and audio that no human naturally produces.
- Level 3 — channel behavior. This is the one most creators miss. Posting 12+ times a day with no variation, never engaging with other channels. That is what a bot looks like, and it gets shut down.
If you use AI tools to help you create content about your own experience and perspective, you are fine. If you type “generate me a script, audio, and video on TOP facts about X” and upload it 20 times a day, you are running a farm, and YouTube will find it.
Channel C’s Videos Are Longer, Which Improves Revenue Density
- Channel C: 16-minute average video length
- Channel D: 12-minute average video length
That difference may not look huge, but at scale it matters. Longer videos usually mean:
- more watch time per view
- more room for mid-roll ad inventory
- stronger session depth
- better potential for evergreen recommendation loops
Channel C is publishing content that gives YouTube more time to monetize each viewer.
Channel C Fixed Revenue Leakage Before Trying to Scale
This is one of the smartest differences in the setup.
When Channel C came to AIR, the channel was already publishing regularly, but monetization was leaking badly: 53 videos had yellow icons, and 41 of them were restored to full monetization after manual review and appeals.
That means we helped the channel stop losing money on content that was already working.
This is an important distinction:
- Channel D’s gains came from new discovery
- Channel C’s gains came partly from recovering monetization on existing inventory
That kind of fix is often less flashy than metadata growth, but it directly increases revenue efficiency. If your channel is losing money to yellow icons, reach out to us . We’ll help restore your videos to full monetization.
Channel C Added a Steady Always-on Layer: 24/7 Streams
This is another key reason it out-earns Channel D.
AIR helped Channel C launch 24/7 live streams built from pre-recorded videos, and then trained the team to run them independently.
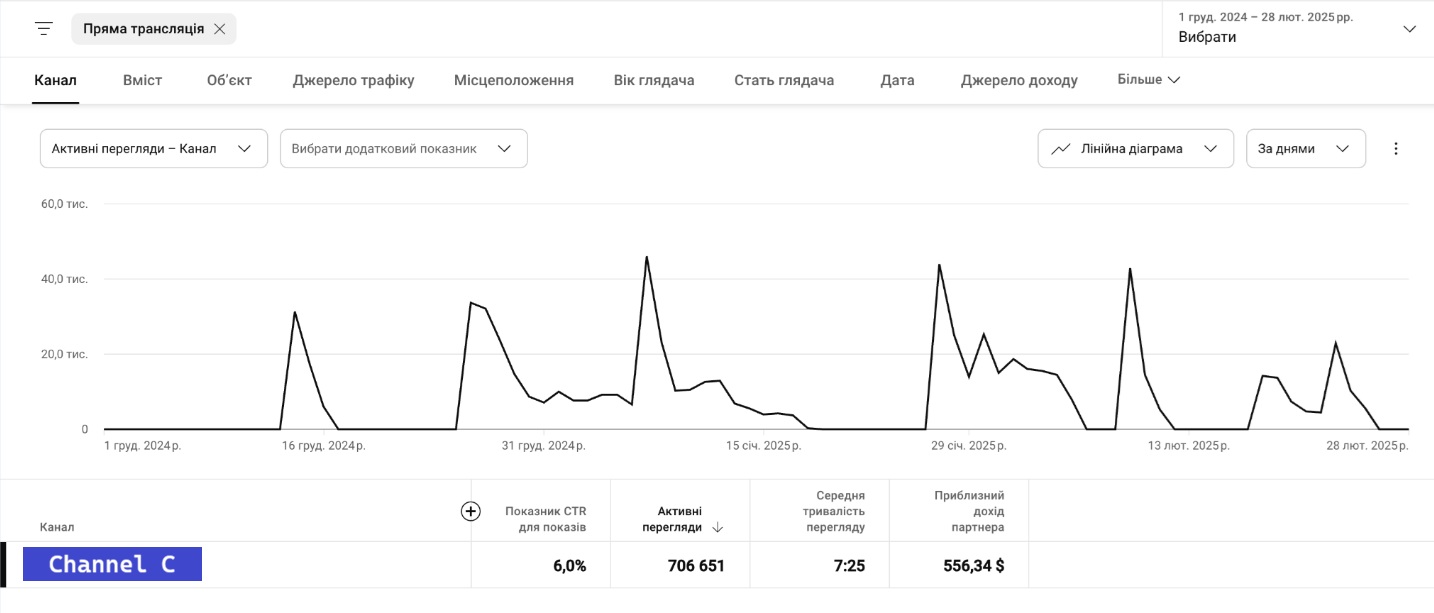
This screenshot is filtered to live-stream content, showing that from December 1, 2024, to February 28, 2025, the stream layer generated:
- 706,651 engaged views
- 7:25 average view duration
- $556.34 in partner revenue
- 6.0% CTR
The direct revenue from streams is not huge on its own. But that is not the full point. The strategic value is that streams:
- add baseline watch time
- extend viewer sessions
- keep the channel monetizing even without a new upload
- create another layer of ad inventory on top of the existing library
Channel C has a continuous monetization layer running in the background.
Read a full case on how they used 24/7 streaming here.
Why Channel D is Still Extremely Strong
The fact that Channel D earns a bit less does not mean it is weaker. It means it is monetizing through a different architecture.
Channel D’s growth is more discovery-led than infrastructure-led.
In just 30 days, from December 18 to January 18, Channel D posted the same number of videos as in the previous month: 9. But after metadata localization was rolled out, searchability improved across non-English markets, and the channel’s performance shifted dramatically:
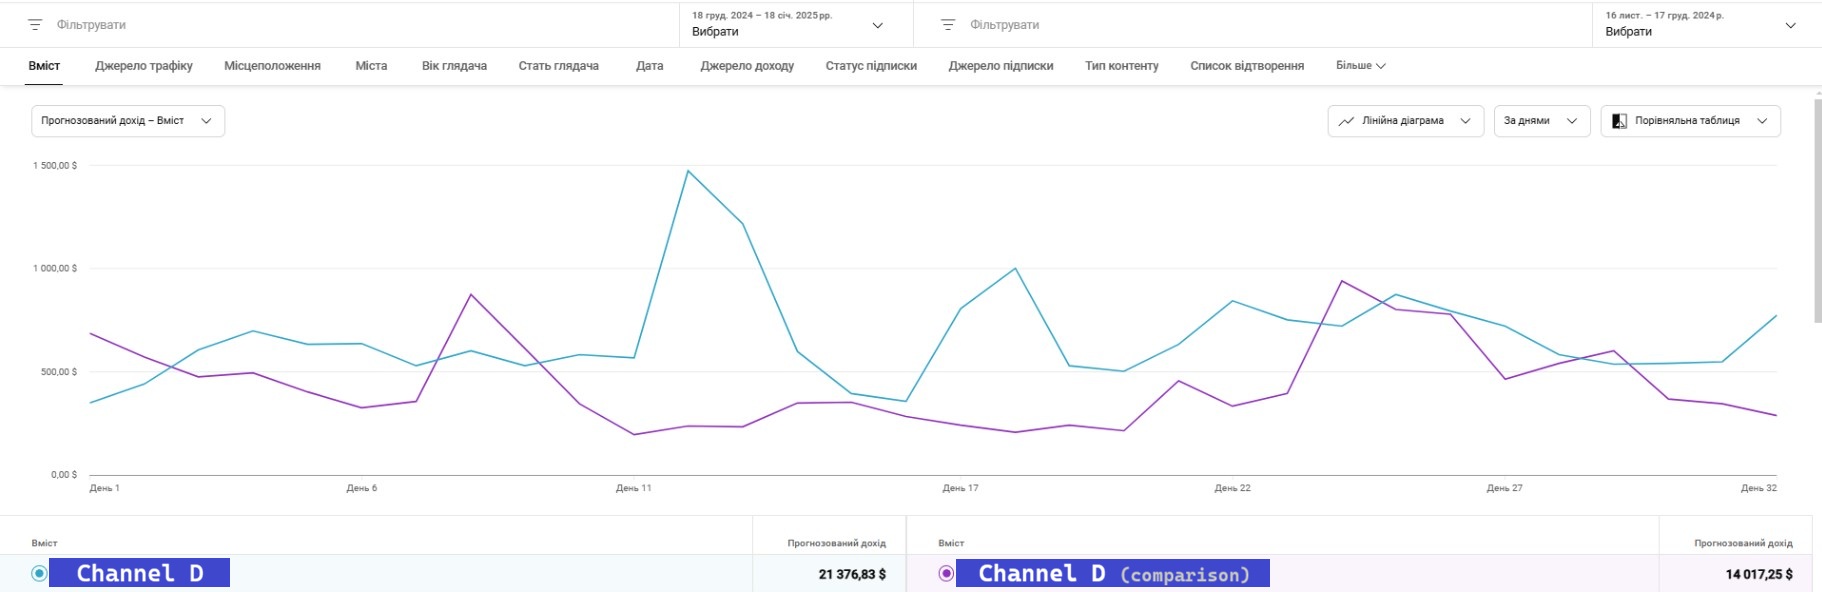
- Views: from 48.5M to 112.3M
- Revenue: from $14,017.25 to $21,376.83
- View growth: +131%
- Revenue growth: +52%
That is about optimization.
Channel D is Using Metadata Localization to Unlock Global Demand
AIR’s key move on Channel D was metadata localization into 10 languages.
That changed discoverability across markets and helped the channel show up in search and recommendations for audiences that were not finding it before.
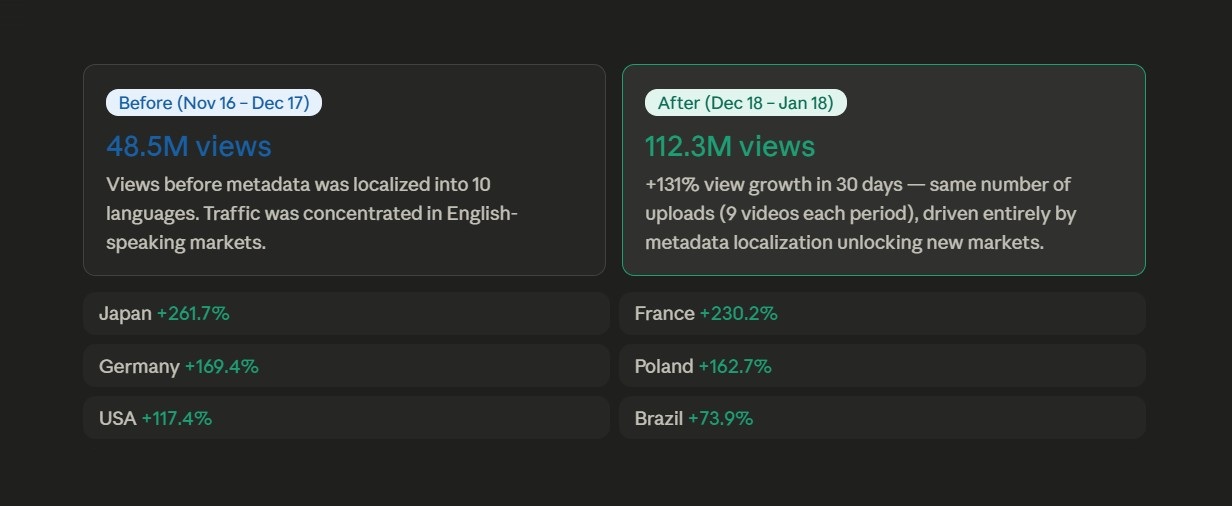
The biggest growth markets were:
- Japan: +261.7%
- France: +230.2%
- Germany: +169.4%
- Poland: +162.7%
- USA: +117.4%
And then further growth also appeared in:
- Brazil
- Italy
- Spain
This is important because these are not random markets. They include several relatively strong CPM geographies:
- USA — $14.67
- Germany — $9.79
- France — $6.76
- Japan — $5.68
- Poland — $5.31
- Spain — $5.61
Channel D is building a stronger international monetization mix, not just more views.
Channel D is More Efficient Per Upload
This is where Channel D looks especially impressive.
It publishes only ~2 videos per week, yet in 30 days, it added:
- 63.8M more views
- $7.36K more revenue
That means the channel is extracting much more performance from each upload through:
- stronger topic selection
- high-trend coverage
- metadata localization
- multilingual discoverability
If Channel C is the better monetization machine, Channel D is the more interesting growth efficiency case.
So, Why Does Channel C Earn $25k While Channel D Earns $21k?
Because Channel C has more monetization layers running at once.
The niche is the same. But here’s what's different:
- 4x more videos
- much higher publishing volume
- longer average videos
- recovered monetization on previously limited content
- live-stream monetization
- Memberships on top
Channel D, meanwhile, is proving something slightly different: with the right metadata strategy, even a channel with fewer uploads and a smaller library can unlock major revenue growth fast.
How Can You Earn More Based on Case Study #2?
This case is useful precisely because the revenue gap is small ($25K versus $21K), but the two channels get there through completely different approaches.
Channel C's most underrated move was fixing yellow-icon monetization before trying to scale anything. When it came to AIR, 53 videos had restricted monetization. Forty-one were restored after review and appeals. Many channels have some version of this sitting unnoticed in their archive.
Channel D's metadata localization result is one of the clearest demonstrations in this article of how much discoverability alone can shift revenue. It went from 48.5M to 112.3M views in 30 days, posting the same number of videos as the previous month. Revenue went from $14K to $21K. Just better labeling across 10 language markets. That is a $7K monthly increase from a metadata project.
The 24/7 stream layer from Channel C adds something different: a revenue floor that doesn't depend on new uploads. The stream generated 706K engaged views over three months from pre-recorded content the channel already had. The direct revenue isn't dramatic, but the watch time it adds and the sessions it extends affect how YouTube values the channel overall.
One note on Channel C's posting volume: 47 uploads per week works because every piece involves genuine editorial judgment. If you are running primarily AI-generated content at that frequency, YouTube's 2026 detection systems flag exactly that behavioral pattern. Volume backed by real human involvement compounds. Volume without it is a different story.
The practical takeaways:
- Audit your full archive for yellow icons before trying to grow anything. Recovering restricted monetization on existing videos is faster and more direct than building new ones.
- Metadata localization into even three high-CPM markets can meaningfully shift discoverability without changing the content itself.
- A 24/7 stream built from your existing archive adds a passive monetization layer. If you have 100+ long-form videos, you have enough to run one today.
- Longer videos matter at scale. The difference between 12-minute and 16-minute average video length is a significant amount of additional mid-roll inventory across a whole library.
- High upload frequency only compounds if there is genuine human involvement behind it. In 2026, that distinction is not optional.
A Quick Case Study #2 Self-Check
- When did you last audit your full video archive for yellow or gray monetization icons? Not just recent uploads, but everything. Restricted monetization on older videos is a consistent revenue drain that most creators do not track systematically.
- Have you appealed any restricted videos? Appeals succeed more often than most creators expect, particularly for videos flagged by automated systems. The default is to leave them restricted. That default costs money.
- Is your channel's metadata (titles, descriptions, tags) available in more than one language? Even localizing into three high-CPM markets can meaningfully shift how YouTube classifies and recommends your content to audiences that were not finding it before.
- Do you have a 24/7 live stream running from your existing archive? If you have 100 or more long-form videos, you have enough content to run one. The direct revenue is incremental, but the watch time it adds and the sessions it extends affect how YouTube values the channel overall.
- Is your upload frequency backed by genuine human editorial involvement on every piece? The question is whether a real person is making meaningful decisions on each upload. Frequency without that is a risk in 2026, not an advantage.
- Are your top-performing videos longer than 12 minutes? At scale, the difference between 12-minute and 16-minute average video length is a significant amount of additional mid-roll inventory and watch time across a whole library.
- Do you know which videos in your archive are your highest-earning ones right now, as distinct from your highest-viewed ones? The two lists are often different, and the earning list tells you something specific about what YouTube is willing to fully monetize on your channel.
Need a second look at your channel’s business model?
A channel can look healthy from the outside while still being built in a way that caps revenue. Contact us for an audit , and we’ll help you spot the hidden weaknesses and opportunities.
Alright, we’ve looked at a scenario where the niche stays the same, and revenue is relatively similar. Now let’s flip the script and change one variable in a big way — revenue.
Case Study #3: Two Translated Kids Channels, ~2.2M Subs Each, ~$40K vs ~$3K
And again, our two partner channels, but now in the kids niche. Similar subscriber base. Very different revenue outcomes.
→ Channel E averages about $40K/month
→ Channel F averages about $3K/month
At first glance, that gap looks strange.
The niche is the same. Both are translated. Both have around 2.1M–2.3M subscribers. In fact, Channel F even has a bigger library and longer average videos.
But once you break down how they are built, the difference starts to make sense. One channel is optimized for multilingual long-form monetization. The other is closer to a reach-heavy, mixed-format channel that does not convert that scale into revenue nearly as efficiently.
Here’s the structural breakdown:
|
Metric |
Channel E |
Channel F |
|
Niche |
Kids |
Kids |
|
Subscribers |
2.3M |
2.1M |
|
Monthly revenue |
~$40K |
~$3K |
|
Avg. video length |
28 min |
46 min |
|
Upload frequency |
~3/week |
~2/week |
|
Total videos |
1.2K |
2.7K |
|
Format mix |
Long-form + 24/7 live |
Long-form + many Shorts + 24/7 live |
|
Language setup |
French + full professional dubbing to 14 languages (audio tracks) |
Spanish metadata, globally understandable visuals, and a few English words |
|
Shorts usage |
No Shorts |
Active Shorts usage |
|
Main monetization logic |
High-value multilingual long-form |
Mixed reach, weaker monetization density |
Let’s see why Channel E earns so much more.
French-Speaking Markets Usually Monetize Better Than Latin American Spanish Ones
Spanish metadata will bring most viewers from Latin America, not Spain.
This is another likely reason the gap is so large. Based on our data, Latin American Spanish CPMs are usually much lower than those in French-speaking premium markets.
Here are CPMs for Latin American Spanish-speaking markets:
- Mexico — $1.82
- Brazil — $1.64
- Colombia — $1.25
- Ecuador — $1.24
- Peru — $1.23
- Argentina — $1.10
- Chile — $2.02
And here are CPMs for French-speaking markets:
- France — $6.76
- Canada — $9.93
- Belgium — $7.05
- Switzerland — $12.98
Even before you look at Shorts, dubbing quality, or library mix, a French-led translated channel can sit in a stronger monetization environment than a Spanish-language channel that leans heavily on Latin America.
In practical terms, that means Channel E does not need the same raw volume to generate the same revenue. If more of Channel F’s audience is coming from Mexico, Colombia, Peru, Argentina, and similar markets, while Channel E is pulling stronger shares from France and other higher-value French-speaking markets, the CPM gap alone can create a meaningful revenue difference.
Channel E is Built Around Deep Localization
This is the biggest strategic difference.
Channel E is a dialogue-heavy kids' channel. That means the story depends on spoken language, not just visual action. AIR helped support that model with full professional dubbing into 14 languages through audio tracks.
That matters because dialogue-heavy content usually does not travel well on visuals alone. To monetize globally, it needs proper audio localization.
Channel F is different. Its content is more understandable worldwide even without full translation, because it relies more on visuals and a few simple English phrases. That helps it travel. But it does not mean it monetizes equally well. Its metadata is still in Spanish, which limits how precisely YouTube can classify and recommend it across multiple language ecosystems.
Even though both are “translated kids' channels,” they are not doing the same thing:
- Channel E gives viewers a real local-language experience
- Channel F is more universal visually, but structurally lighter on localization
That makes Channel E much stronger at unlocking monetizable demand in multiple markets.
Channel E’s Content Mix is More Revenue-Dense
This is another major difference.
Channel E:
- no Shorts
- 28-minute average videos
- 24/7 live stream
Channel F:
- 46-minute average videos
- 24/7 live stream
- a lot of Shorts inside a 2.7K video library
That last point matters a lot.
A large video library only helps revenue if the videos are monetizable in the same way. Shorts can be great for reach, but they usually bring much lower revenue density than long-form and live viewing. So Channel F’s 2.7K videos are not the same as Channel E’s 1.2K long-form-centered assets.
In other words, Channel F may have more assets, but Channel E likely has a much higher share of premium, long-form, ad-rich inventory.
That helps explain why the smaller library can still earn much more.
Channel E’s Quarter Shows Revenue Rising Faster Than Views
The screenshots for Channel E make this very clear.
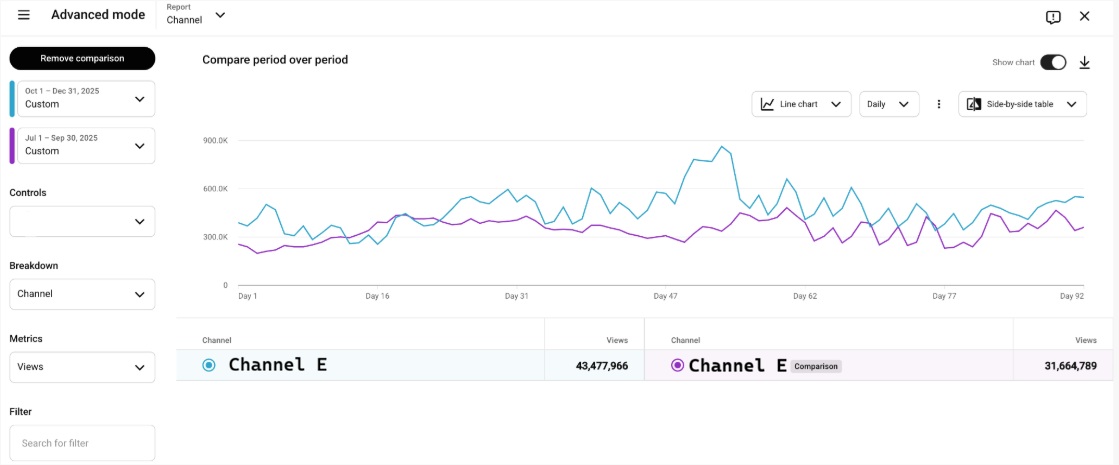
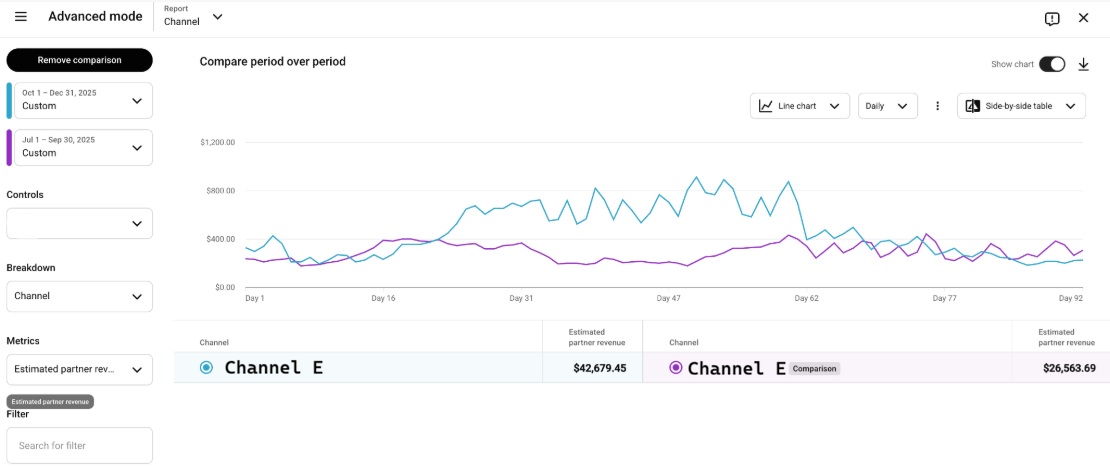
Across the compared periods:
- Views: from 31,664,789 to 43,477,966
- Estimated partner revenue: from $26,563.69 to $42,679.45
That means:
- View growth: about +37%
- Revenue growth: about +61%
That is an important signal.
If revenue is growing much faster than views, then this is not just a traffic story. It means monetization efficiency improved, too.
That lines up well with the work AIR did on the channel:
- content moderation
- thumbnail and title changes
- content-quality training
- a correction plan
- recommendation to increase upload frequency before holidays
- recommendation to upload higher-quality video files
- removal of music copyright problems
- solving the audio-track deletion issue
It is a stack of improvements in monetization and distribution. Together, they helped turn more of the existing view volume into actual revenue.
Channel F Has More Reach Than Revenue Discipline
This is where the difference gets more structural.
Channel F has:
- a larger archive
- longer average videos
- active Shorts usage
- a format that is broadly understandable without heavy localization
That sounds strong on paper. And in one sense, it is. The channel clearly has distribution potential.
But the problem is that reach and revenue are not the same thing.
A mixed library with lots of Shorts often produces:
- more uneven monetization
- lower revenue per thousand views
- weaker long-form revenue density
- less precise multilingual discovery if metadata is still concentrated in one language
Channel F may be accumulating a lot of activity, but not necessarily the kind that converts into a strong monthly baseline.
To be completely clear, the Channel F is not even the core channel of this creator. They have a lot more, and you can explore how they grow them all here.
How Can You Earn More Based on Case Study #3?
The 13x revenue gap between channels comes down to three things: geography, localization depth, and content format mix.
Channel F's Spanish metadata routes most of its audience through Latin America — CPMs between $1.10 and $1.82. Channel E targets French-speaking markets at $6.76–$12.98. The same video, the same watch time, and a 5x to 7x difference in what YouTube pays. Channel E does not need Channel F's view volume to out-earn it. The CPM gap does most of the work.
Localization depth compounds that. Channel E is dubbed professionally into 14 languages via audio tracks. A viewer who hears content in their own language watches longer. Completion rate drives recommendation.
Channel F has 2.7K videos, but a significant portion are Shorts: high reach, low revenue density, no mid-rolls. Channel E's 1.2K videos are almost entirely long-form. Total video count overstates Channel F's monetizable inventory. Long-form video count is the number that actually matters.
Channel E's revenue grew 61% while views grew 37%. When revenue outpaces views, monetization efficiency is improving. That came from specific fixes — content moderation, thumbnail updates, music copyright removal — each converting more existing views into actual money. The gap between current and potential revenue often lies in how existing content is set up, not in content that hasn't been made yet.
The practical takeaways:
- The language market your channel targets is a revenue decision, not just a content decision. Knowing CPMs by market before you localize changes which markets you prioritize.
- Shorts inflate your video count without inflating your revenue. The meaningful library metric is monetizable long-form videos only.
- Audio dubbing and subtitle-only localization produce different completion rates, which produce different recommendation outcomes, which produce different revenue.
- Revenue growing faster than views means monetization efficiency is improving. That gap is usually found in the details of how existing content is set up — not in new uploads.
- Music and audio copyright claims can quietly redirect ad revenue away from your channel without showing as a visible restriction.
A Quick Case Study #3 Self-Check
- Open your YouTube Analytics and look at your top 10 countries by watch time, specifically, not by views. Watch time is what YouTube monetizes. If your highest-view countries are not your highest watch-time countries, there is a meaningful discrepancy worth understanding.
- What are the average CPMs for your top 5 markets? If your highest-view markets are also your lowest-CPM markets, more content will not fix the revenue gap; a localization strategy will.
- What percentage of your video library is Shorts? If it is above 30%, your total video count is overstating your monetizable inventory. The number that reflects your ad revenue potential is for long-form videos only.
- Is your translated content dubbed with real audio or subtitled? Pull the average view duration for translated content versus original-language content. A significantly lower AVD on translated videos usually points to an audio barrier. Viewers can see the content, but are not staying for it.
- Is your channel's metadata (titles and descriptions) available in each language you have dubbed or subtitled into, or is everything still in your primary language? A French audio track with an English title sends a mixed signal that limits how confidently YouTube places you in French-language recommendations.
- Have you checked your archive for music or audio copyright claims that are splitting your revenue with rights holders? A video can still get views and still appear monetized while the ad revenue is going entirely to a third party. We can take a look and help to solve that copyright issue.
- Is revenue growing at roughly the same rate as views, faster, or slower? If views are growing but revenue is flat or growing more slowly, the gap is usually geography, content format mix, or monetization restrictions.
- When did you last update thumbnails on your highest-viewed older videos? Thumbnails can be changed after publishing with no penalty, and click-through rate is one of the signals YouTube uses to decide how broadly to push a video into browse and suggested feeds. We can help you change thumbnails to ones that work better.
Want Your Channel to Earn More?
Every case study in this article started the same way. We:
- looked at what the channel was built to do
- found where revenue was leaking or capped
- and mapped out what needed to change
That is what a proper channel audit does. A specific breakdown of your monetization structure, content setup, localization gaps, and traffic quality, with a clear list of decisions and steps that apply to your channel specifically.
We do this every day. The AIR team has eyes on more than 3,000 channels daily and proprietary technology trained specifically to identify growth and monetization opportunities — the kind of patterns that are invisible from inside a single channel but obvious when you have seen thousands of them.
We use a combination of human expertise and purpose-built tooling.
And if you want to go further than the audit itself, we can help you implement everything we find. Metadata localization, dubbing, Membership setup, yellow-icon recovery, and 24/7 streams. You do not have to figure out how to execute it on your own.
Start with our expert channel audit for a hands-on review from specialists and grow your revenue faster.


