



YouTube Studio shows three numbers for how long people watch your videos: watch time, average view duration (AVD), and average percentage viewed (APV). All three come from the same viewing data, but each one answers a different question. Read the wrong one, and you'll fix the wrong thing.
The "good" numbers most guides quote are also higher than what most videos reach. A 5–15 minute video is usually told to aim for 40–55% viewed. In AIR Media-Tech's data from 21,755 videos on 302 channels we work with, only the top quarter of videos clears 41%, and the median sits at 30%.
So we went through YouTube's own definitions and Studio data on videos, and put together what a creator needs: what each metric measures and how YouTube calculates it, which one to check for which question, what counts as a good AVD and APV at each video length, and the two places where watch time works differently than most creators expect.
|
Metric |
What it measures |
Formula |
Question it answers |
When to use it |
|
Watch time |
Total minutes or hours viewers spent on a video or channel |
Sum of all minutes watched by all viewers |
How much attention did this earn in total? |
Channel scale, revenue potential, the YPP watch-hour threshold |
|
Average view duration (AVD) |
Average length of one view |
Total watch time ÷ total views |
How long does one viewer stay? |
Per-video quality, mid-roll value, comparing videos of similar length |
|
Average percentage viewed (APV) |
Average share of the video watched per view |
(AVD ÷ video length) × 100 |
What fraction of the video do viewers watch? |
Comparing videos of different lengths, testing runtime |
Here's how the three metrics compare:
Key takeaways
- Three numbers, three questions. Watch time is the total time watched, AVD is how long one view lasts, and APV is that view as a share of the video.
- Only the top quarter of 5–15 minute videos clears 41% APV. The median is 30%, in AIR Media-Tech's data from 21,755 long-form videos on 302 channels, published in 2025.
- Compare a video with its own length. Use the benchmark for its length band and your typical retention line in Studio, not one "good" number.
- Shorts hours don't count toward 4,000. Shorts have their own eligibility rules that count toward YPP.
Benchmarks in one line:
Across 21,755 long-form videos from 302 AIR partner channels, the top quarter of videos hold 46%+ APV at 3-5 minutes, 41%+ at 5-15 minutes, 33%+ at 15-60 minutes, and 25%+ past an hour. The median video sits at 38%, 30%, 26%, and 17%. Compare every video against its own length band, never against a single "good" number.
Watch Time, AVD, and APV: What Each Metric Measures
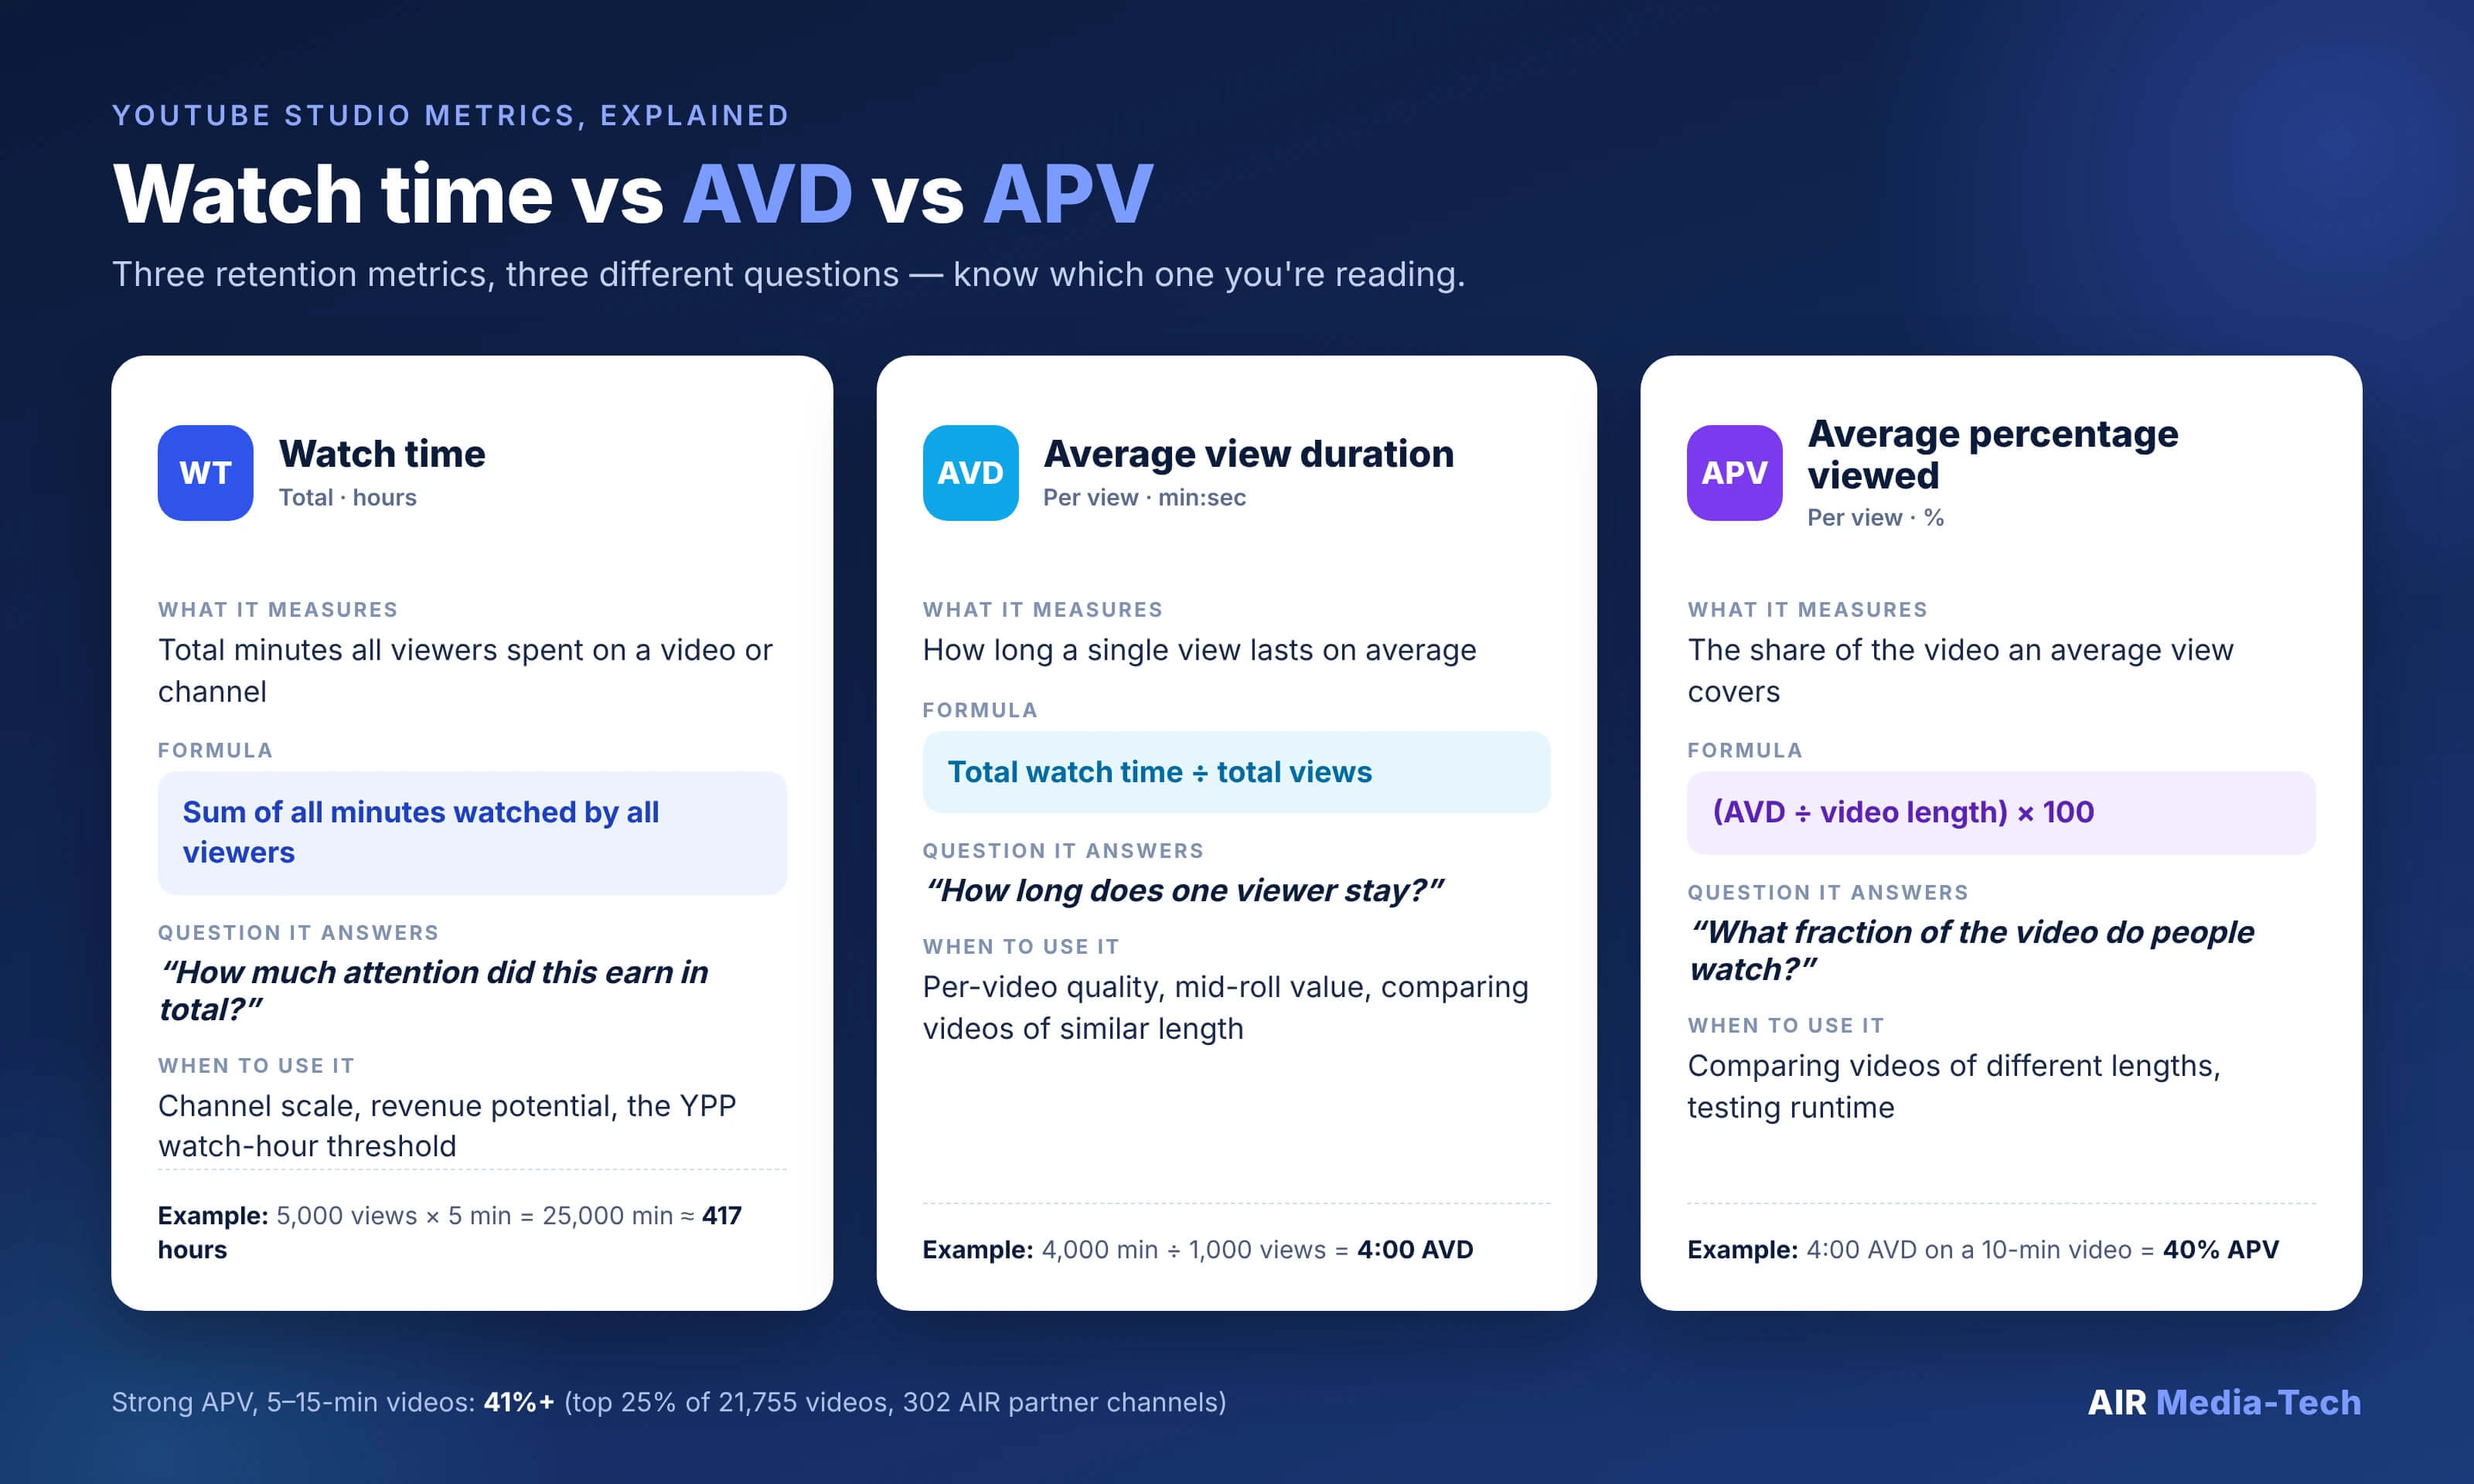
Watch time measures scale, AVD measures depth per view, and APV measures depth relative to the video’s length. Wait, we hear you ask, isn’t that basically the same thing? To that, we answer that the three metrics are three different readings of the same viewing data that help us determine what might not work as well on your channel!
Watch Time
Watch time is the total time viewers spent watching your content. So, if 5,000 people each watch 5 minutes of a video, that video (in theory) earns 25,000 minutes, or about 417 hours, of watch time.
Watch time is an aggregate metric: it grows with both views and per-view depth, so a video can gain watch time while losing views.
A Japanese gardening channel we work with shows how that plays out. In September 2025, it moved from 20–25 minute videos to 25–30+ minutes. Over the next three months, AVD grew from 10:22 to 12:19, and views fell 9%, but watch time grew 7.6% (from 239,623 to 257,829 hours), and revenue rose 20%. About half of that revenue growth came from the usual Q4 rise in ad rates; the rest came from the extra watch time.
A Japanese DIY gardening channel, Sept–Dec 2025
What changed
Videos went from 20–25 to 25–30+ minutes
AVD
10:22 → 12:19
Views
−9%
Watch time
+7.6% (239,623 → 257,829 hours)
Revenue
+20%, about half of it from the Q4 rise in ad rates
YouTube uses this metric at the channel level, including for monetization eligibility: the YouTube Partner Program requires 1,000 subscribers plus 4,000 qualified public watch hours in the last 12 months or 10 million qualified Shorts views in 90 days.
Qualified hours come only from public long-form videos and live streams that stay archived. Shorts, ads, and unarchived streams don't count. The bar is also going up: from February 1, 2027, new applicants need 8,000 qualified watch hours or 20 million qualified Shorts views, while channels already in YPP keep their status.
What a new channel needs to join the YouTube Partner Program
Until February 1, 2027
4,000 hours
1,000 subscribers plus 4,000 qualified watch hours in the last 12 months, or 10 million qualified Shorts views in 90 days
New applicants from February 1, 2027
8,000 hours
1,000 subscribers plus 8,000 qualified watch hours, or 20 million qualified Shorts views. Channels already in YPP keep their status
Only public long-form videos and archived live streams count toward watch hours. Source: YouTube Help and YouTube Blog.
Average View Duration (AVD)
AVD is the average length of a single view, shown in minutes and seconds. The formula here is this: total watch time ÷ total views. So, a video with 4,000 minutes of watch time across 1,000 views has an AVD of 4:00.
AVD is the per-video quality signal:
It tells you how long the typical viewer stays before leaving. In absolute minutes, it also decides ad value: YouTube allows mid-roll ads only on videos 8 minutes or longer, and a mid-roll placed at minute 9 earns nothing from viewers who leave at minute 4.
AVD also depends on length: four minutes is strong on a 5-minute video and weak on a 40-minute one.
Average Percentage Viewed (APV)
APV is AVD divided by video length, expressed as a percentage:
(AVD ÷ video duration) × 100. A 10-minute video with a 4:00 AVD has 40% APV
APV normalizes for length, so it’s the metric to use when you compare a 4-minute explainer with a 25-minute deep dive. On Shorts, APV can pass 100% because loops and rewatches still count toward watch time.
The takeaway: watch time answers "how much total time," AVD answers "how long does one view hold," and APV answers "what share of the video do people watch."
|
What you see |
What it usually means |
|
High APV, low watch time |
The video holds viewers, but few people see it; reach (impressions, CTR) is the bottleneck, not retention |
|
High AVD, low APV |
Viewers stay for many minutes, but the runtime is longer than the content can sustain |
|
High watch time, low AVD |
View volume is carrying a weak per-view result; broad traffic is leaving early |
|
AVD and APV rising together |
The runtime fits the content |
The last row is what an entertainment channel we work with saw in September 2025, after it kept every upload within 10–15 minutes:
- average video length grew 25% (10:04 → 12:35)
- AVD grew 30% (5:39 → 7:21)
- APV moved from about 56% to about 58% (AVD divided by average length)
The videos got longer, and viewers watched a larger share of each one. At about 58%, the channel sits well above the 41% top-quarter line for that length. To find where in a video viewers leave, read the retention graph rather than these summary numbers.
The Short-Video Paradox: Why High Retention Can Mean Low Reach
A 4-minute video at 50% APV looks better in Studio than a 20-minute video at 33%. Per viewer, it's the other way around: 50% of 4 minutes is 2:00, and 33% of 20 minutes is 6:36. If both get the same number of views, the 20-minute video earns more than three times the watch time.
APV doesn't decide reach on its own either. YouTube lists clicks, watch time, survey answers, shares, likes, and dislikes among the signals its recommendations use. So a short video with high APV can still get fewer views if fewer people click on it, or if two minutes per viewer is all it gives.
It works the other way too. When the shorter video gets more views, its higher APV can add up to more total watch time:
|
Video |
APV |
AVD |
Views |
Watch time |
|
4-minute video |
50% (top quarter) |
2:00 |
5,000 |
≈167 hours |
|
12-minute video |
30% (median) |
3:36 |
1,000 |
≈60 hours |
Padding a video to push watch time up backfires. Minutes the content can't hold lower APV, and mid-rolls placed in them play to viewers who have already left.
A kids' toy channel we work with ran into this in 2025. Its compilations ran 28+ minutes and held 8–12% APV, less than half the 26% median for that length. After it switched to shorter compilations, APV rose to 16.4–22%, its share of views from recommendations grew from 67.3% to 75% year over year, and quarterly revenue rose 17.8%.
Is your retention low, or just normal for your video length? Check for free
The Free Channel Check puts your numbers next to a channel in your niche that you pick and shows what to fix first. It takes about 5 minutes.
Check my channel for freeRetention Benchmarks by Video Length: Only the Top Quarter Clears 41%
In AIR Media-Tech's data from 21,755 long-form videos on 302 channels, a strong APV is 46% or more for 3–5 minute videos, 41% for 5–15 minutes, 33% for 15–60 minutes, and 25% past an hour. That's the line the top quarter of videos clears in each length band. The median video sits lower, at 38%, 30%, 26%, and 17%, and that's a normal place to be.
|
Length |
Typical content |
Strong APV (top 25%) |
Median APV |
Example AVD: strong / median |
|
3–5 min |
Short tutorials, explainers |
46%+ |
38% |
4-min video: 1:50 / 1:31 |
|
5–15 min |
Tutorials, vlogs, reviews |
41%+ |
30% |
10-min video: 4:06 / 3:00 |
|
15–60 min |
Deep dives, long tutorials, video essays |
33%+ |
26% |
30-min video: 9:54 / 7:48 |
|
Over 60 min |
Podcasts, compilations, full episodes |
25%+ |
17% |
90-min video: 22:30 / 15:18 |
Source: AIR Media-Tech, YouTube Studio data from 302 partner channels, 21,755 long-form videos (over 3 minutes, 1,000+ views) published in 2025. "Strong" = the top 25% of videos in each length band; "median" = the middle video.
APV for a 5–15 minute video
What most guides call good
40–55%
vidIQ, July 2026
Where the top quarter starts
41%
AIR Media-Tech, 21,755 videos
The median video sits at 30%, so 35% on a 10-minute video is above average.
The primary signal shifts with length: under 5 minutes, track APV; from 15 minutes up, AVD in minutes is a bit more important, because 30% of a 40-minute video still delivers 12 minutes per viewer and several mid-roll slots.
Two formats sit outside this dataset:
- YouTube Shorts: An APV over 100% means viewers replay the Short. Track it together with the viewed vs. swiped away chart in Studio, which shows how many people chose to watch the Short instead of scrolling past it. For examples from real channels, see what viral YouTube Shorts analytics look like.
- Live streams (including 24/7): Percentages don't apply, so track AVD in minutes and concurrent viewers. On AIR-managed channels, stream AVD ran well above regular uploads: Boxing Mates reached 11:10 on streams against 3:01 on uploads, INRI Motivation 32:19 against 17:04, and Dream Fairy DIY 5:58 against 1:56.
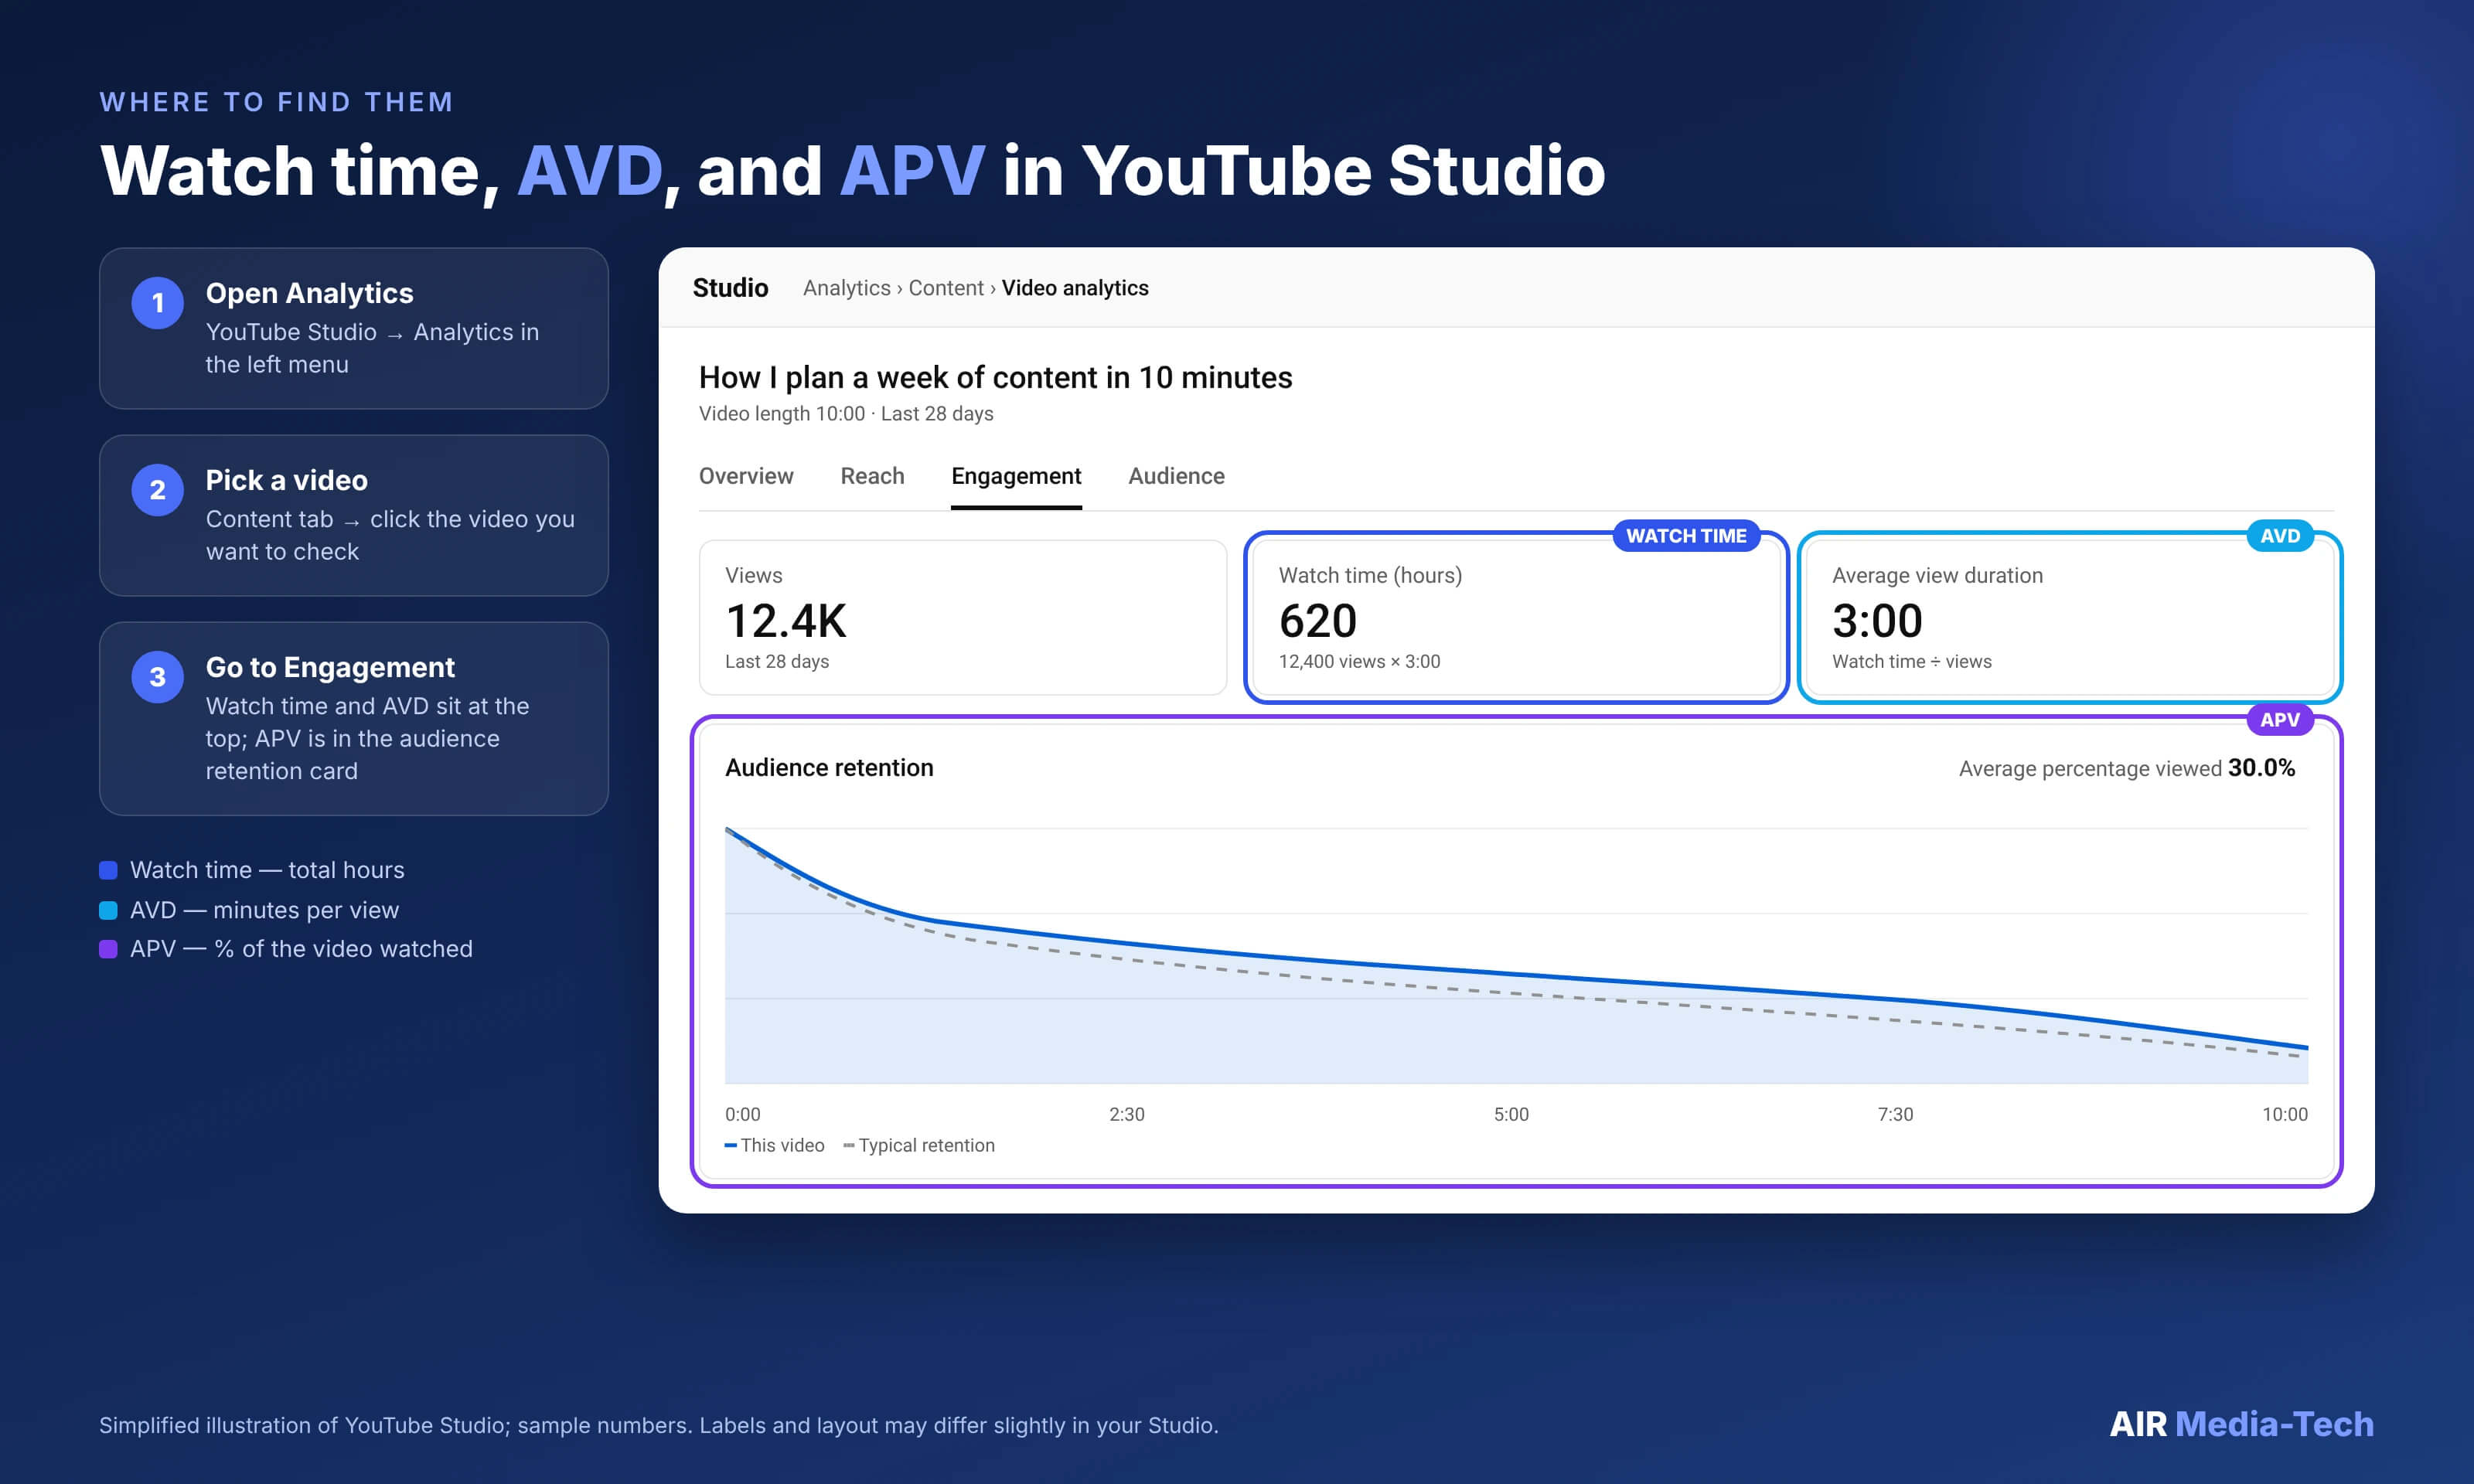
Your own baseline matters more than any cross-channel number. The audience retention report in YouTube Studio has a typical retention line that compares a video with your 10 latest videos of similar length. A video above that line works for your audience. For runtime data by niche, see AIR Media-Tech's study of ideal video length across 18,000 channels.
Two Nuances Most Creators Miss
Playback speed and Shorts are the two places where watch time behaves differently from what most creators expect.
Playback Speed Cuts Watch Time, Not the Share Watched
A viewer who watches a 10-minute video at 2x speed finishes in 5 real minutes, and that's what goes into watch time: 5 minutes, not 10. The share of the video they covered doesn't shrink. They still watched all of it, so it counts as 100% viewed, not 50%, according to AIR's key account managers. That's why, on channels where many viewers speed up, AVD divided by video length can come out lower than the APV Studio shows.
Shorts got a 2x speed option in July 2026, so the same applies there: faster viewing lowers watch time, not the share of the Short watched.
Shorts Watch Time Doesn't Count Toward YPP
Shorts watch hours don’t count toward the 4,000-hour threshold, per YouTube’s eligibility rules. Shorts have a separate path (10 million qualified Shorts views in 90 days) and a separate recommendation system. Plan the content mix with that split in mind: a Shorts-heavy channel chasing 4,000 watch hours needs long-form uploads to get there.
Watch Time vs AVD vs APV: Which One to Check First
Start with the question you have, not the number Studio shows first:
- Is the channel getting close to monetization? Check watch time in the Earn tab of YouTube Studio.
- Does this video hold people? Check its APV against the benchmark for its length.
- Are your mid-rolls earning? Check AVD in minutes against where your mid-rolls sit.
Then find where viewers leave. Check how to edit videos so viewers don't drop off at minute 8.
You know your numbers. Not sure what to fix first?
A Full Channel Audit compares your Studio data with 3 channels you choose, shows where viewers leave and why, and ends with a ranked plan of what to fix first.
- All 10 analytical blocks, from packaging and retention to monetization
- Your AVD, APV, and watch time next to 3 channels you choose
- Every fix ranked by effort and expected impact
- Read-only Studio access, no revenue share, no network contract
![Live Auto Dubbing, Made on YouTube, and More [September 2026]](https://air.io/storage/YQmIVErjRp29SNJNDzwXGhnaZx7TBahOGmY9hILX.jpg "Live Auto Dubbing, Made on YouTube, and More [September 2026]")