
![First 500M Subscriber Award, Creator Consultation, Search Profiles, and More [June 2026]](https://air.io/storage/3FBRm5HTWaDBrOmkopJzVIJKijxnTYH2VSXZfKnv.jpg "First 500M Subscriber Award, Creator Consultation, Search Profiles, and More [June 2026]")


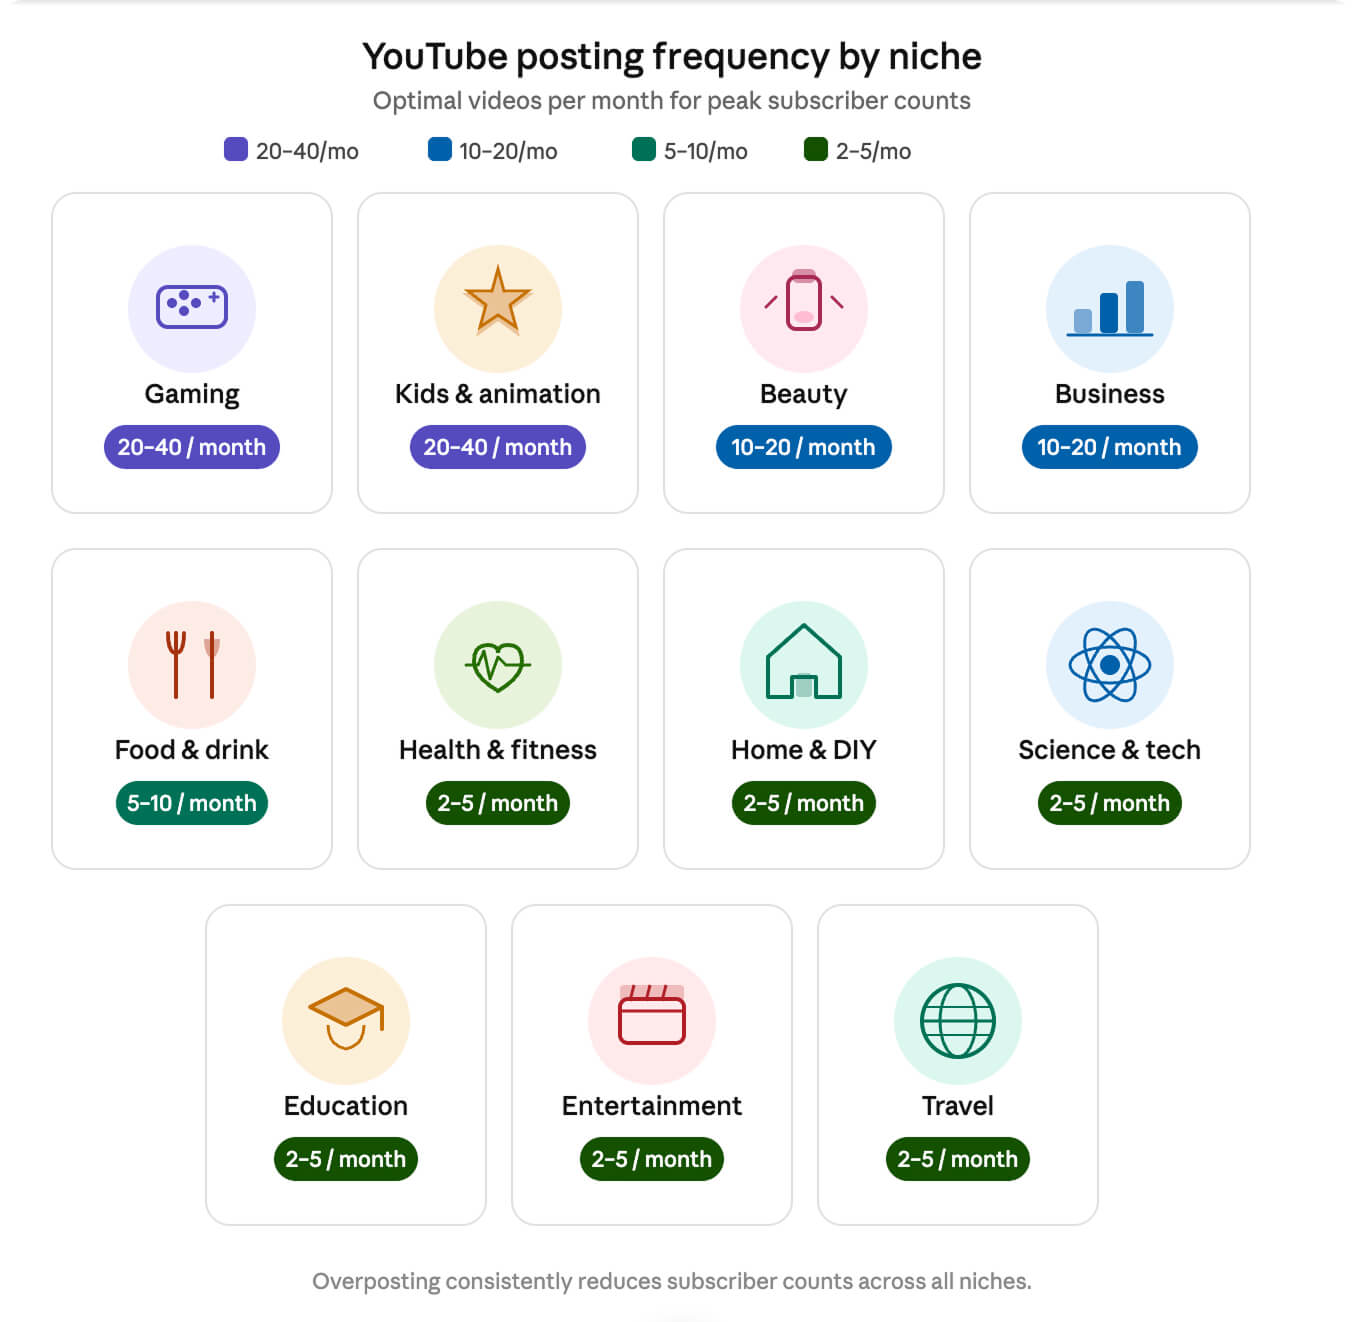
Posting more on YouTube mostly helps, but only if the content satisfies viewers. And "more" means something different depending on your niche. For gaming channels, more means 20–40 videos a month. For travel channels, more means 2-4 per month. And posting above the niche benchmark almost always hurts. The channels in our dataset that over-posted had 55% fewer subscribers than channels that posted at the optimal rate.
The one thing that holds across every niche: a consistent schedule beats an erratic one. We analyzed 18,000 channels to find the optimal posting frequency for each niche on YouTube. The full breakdown is below.
What's the Best YouTube Posting Frequency by Niche?
Posting frequency varies widely by niche. Gaming and kids content reward high volume (20–40/month), while most other niches peak at 2–10/month, with overposting consistently hurting subscriber counts.
The data below focuses on the 100K–1M monthly views channel segment.
|
Niche |
Optimal freq |
Channels analyzed |
Median subs (peak) |
Drop at highest freq |
|---|---|---|---|---|
|
Gaming |
20–40/mo |
2,294 |
69,800 |
52,000 at 40+/mo |
|
Kids & Animation |
20–40/mo |
246 |
76,600 |
50,500 at <2/mo |
|
Beauty |
10–20/mo |
193 |
177,000 |
76,050 at <2/mo |
|
Business |
10–20/mo |
285 |
106,000 |
64,100 at 20–40/mo |
|
Food & Drink |
5–10/mo |
296 |
136,000 |
60,000 at 40+/mo |
|
Health & Fitness |
2–5/mo |
312 |
172,000 |
68,100 at <2/mo |
|
Home & DIY |
2–5/mo |
511 |
114,000 |
83,050 at <2/mo |
|
Science & Tech |
2–5/mo |
572 |
110,000 |
49,800 at 40+/mo |
|
Education |
2–5/mo |
134 |
116,000 |
63,750 at 40+/mo |
|
Entertainment |
2–5/mo |
2,435 |
76,200 |
59,500 at <2/mo |
|
Travel |
2–5/mo |
434 |
60,250 |
53,600 at 40+/mo |
Feel like something's off with your channel?
Most channels have two or three structural problems invisible from the inside – in packaging, traffic routing, or format mix. Our analysts have found them across 3,000+ channels. We'll find them in yours.
Find what’s offBut Posting Frequency Is Not the Full Story
YouTube's recommendation system doesn't reward raw upload count. It distributes content based on viewer satisfaction signals — watch time, click-through rate, engagement. A channel that posts ten videos a week with poor retention metrics won't outperform one that posts twice a week with strong watch time.
Our data shows over-posting hurts in most niches. The extra videos don't add distribution — they compete with each other and dilute the watch-time signals the algorithm uses to recommend your content. In Health & Fitness, channels posting 10–20 times per month have 55% fewer subscribers than channels posting 2–5 times. The content is thinner, the algorithm reads it as lower quality, and recommendations slow.
The formula that works: post at your niche's natural ceiling, with content built to hold viewers — and post on a schedule predictable enough for both the algorithm and your audience to rely on.
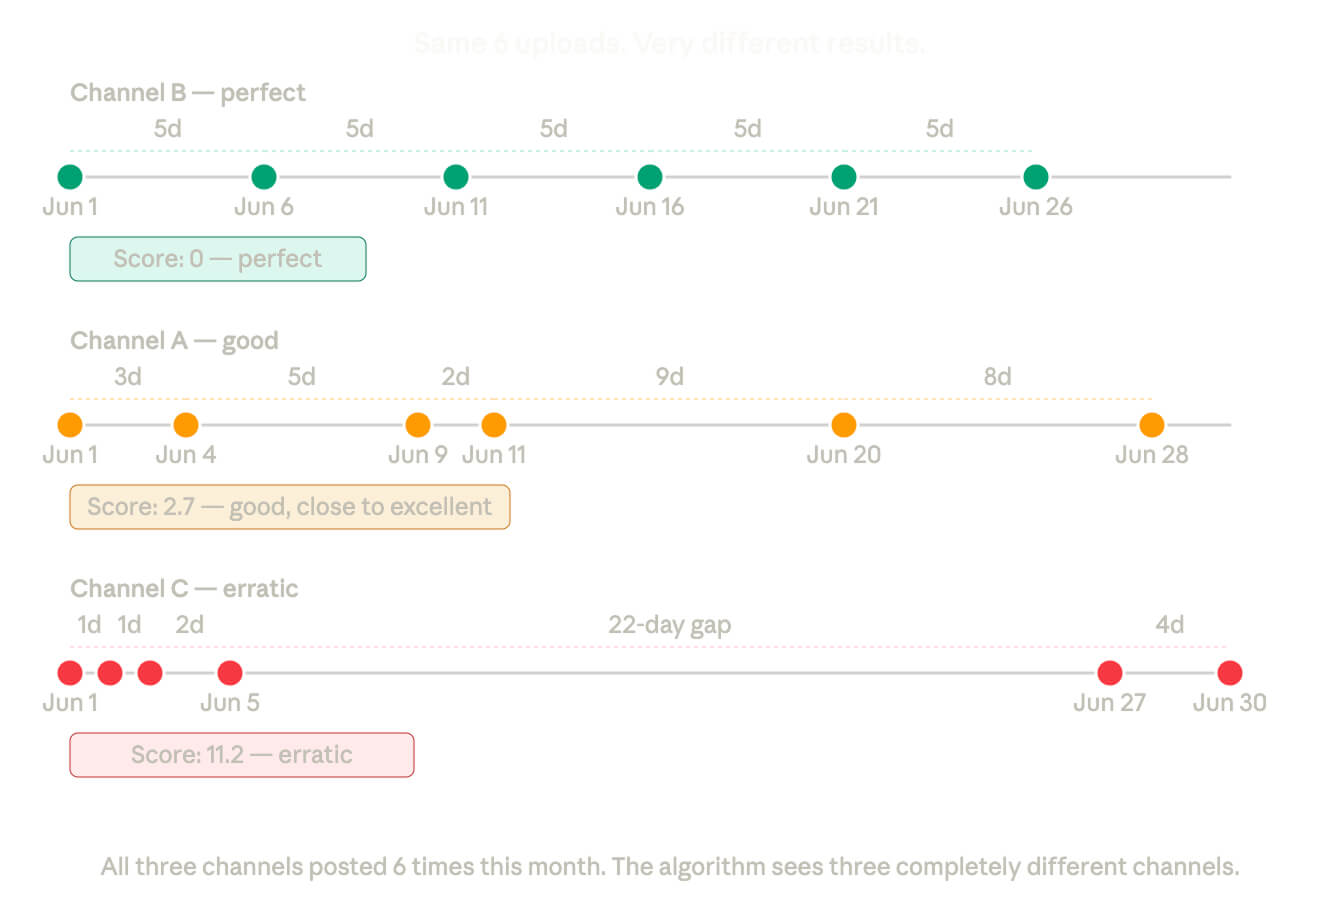
Why Does YouTube Consistency Score Matter More Than Volume?
The consistency score measures how evenly spaced your uploads are. It's the standard deviation of the gaps between your upload dates — the lower the number, the more predictable your schedule.
Channels that posted on a predictable schedule got more views per subscriber than channels that posted the same number of videos but on random days, across every niche in our dataset.
- If you upload every Tuesday: great. YouTube can predict your next upload. Score close to 0.
- If you upload whenever you feel like it — three videos this week, nothing for three weeks, two more in a burst — the algorithm can't predict you. Score of 10+.
- The algorithm treats these two channels completely differently, even if they posted the same total number of videos that month.
How to find your score in 2 minutes:
- Open YouTube Studio → Content → sort by upload date.
- Write down the gaps between your last 20–30 uploads. "I posted, then 5 days passed, then 3 days, then 12 days…"
- Find the average. Add all the gaps and divide by how many there are. If your gaps are 3, 5, 2, 9, 8 — that's 27 ÷ 5 = 5.4 days average.
- Open Google Sheets or Excel, paste your gap numbers, and type =STDEV(3,5,2,9,8). Hit enter. The result — 2.7 in this example — is your consistency score. The lower the number, the more evenly spaced your uploads are.
What the score means:
- 0–2: YouTube knows exactly when to expect you. So does your audience.
- 3–5: Small variation. Still reliable enough to build habits.
- 6–10: Irregular enough that the algorithm stops counting on you.
- 10+: Unpredictable. The algorithm treats you like a new channel every time you post.
Two channels can post the same number of videos per month and get completely different results — not because of what they posted, but because of when.
Does Consistency or Quantity Matter More on YouTube?
Posting on a regular schedule beats posting more. Across every niche in our dataset, channels that uploaded on a predictable cadence outperformed channels that posted the same number of videos but on random days.
The gap is biggest in the middle — channels posting 5–20 videos per month. At that frequency, a consistent schedule makes a measurable difference in subscriber count. Channels that post erratically at the same average volume end up in the bottom half of their niche.
Taking unplanned breaks makes it worse. Channels that went dark for 14+ days three or more times a year got fewer views per video than channels that maintained their rhythm. Smaller channels feel this more — large channels with established audiences can absorb a pause. Smaller ones can't. If your traffic has already dropped from an inconsistent period, see our guide on regaining YouTube views after traffic issues.
How Much Does Taking a Break From Posting Hurt?
The more you post, the harder the break hits your performance.
Gaming and Kids channels are the most sensitive to gaps. When your audience is conditioned to see content from you daily, a 14-day absence breaks that habit faster than in niches where twice-a-week is already unusual. In Science & Tech, Education, and Travel — where 2–5 videos per month is the baseline — a planned 2–3-week break causes far less damage.
|
Niche |
Effect of 3+ breaks/year |
Notes |
|---|---|---|
|
Gaming |
Significant drop in views/video |
Audience expects constant content |
|
Kids & Animation |
High sensitivity to gaps |
Young audiences lose their habit fast |
|
Health & Fitness |
Moderate |
2–5/mo pace already builds in breathing room |
|
Science & Tech |
Low sensitivity |
Audience accepts a slower cadence |
|
Education |
Low sensitivity |
Subscribers expect longer gaps already |
|
Travel |
Low sensitivity |
Seasonal patterns accepted |
|
Entertainment |
Moderate |
Depends on format — series vs standalone |
A single announced break followed by a return to consistent posting does significantly less damage than months of erratic uploads. If you need to pause, plan it, say it, and come back on schedule.
How We Ran This Study
Our dataset was 18,000 English-language YouTube channels across 11 niches. 12-month upload activity snapshot. English-speaking markets only (US, UK, Canada, Australia; India excluded). Primary analysis on the 100K–1M monthly views segment.
- What we excluded: YouTube Shorts (analyzed separately), news and live-stream-heavy channels, and any channel where a single video received more than 10× its channel average in views — those viral spikes distort the dataset.
- What we measured: average videos per month, publishing intervals in days, standard deviation of those intervals (consistency score), and median subscriber count per niche-frequency combination.
This is correlational data, not causal. We can show that channels at a given frequency level within the same monthly-views segment end up with higher or lower subscriber counts. The patterns are consistent across large sample sizes and stable across niches. They're directionally reliable.
With that said, the patterns are consistent across large sample sizes and stable across niches. They're directionally reliable. Here's how each niche breaks down.
The Data Splits by Niche. Jump to Yours
Optimal video length varies across niches, sometimes by several minutes. The data below covers 10 niches across four channel-size segments. Click your niche to jump straight to the numbers.
- Gaming
- Science & tech
- Food & cooking
- Fitness
- Beauty
- Travel vlogs
- DIY & home
- Business & finance
- Entertainment
- Kids & animation
- Education
Should Gaming Channels Post More Videos?
Gaming is the only niche where more is almost always better. Channels posting 20–40 videos per month have nearly double the subscribers of channels posting fewer than 2. Every step up in frequency adds subscribers — until you hit 40+/mo, where quality starts to slip and the numbers drop.
|
Freq bucket |
Channels |
Median subs |
Top 25% |
|---|---|---|---|
|
<2/mo |
366 |
37,500 |
120,500 |
|
2–5/mo |
473 |
42,400 |
156,000 |
|
5–10/mo |
477 |
44,800 |
155,000 |
|
10–20/mo |
464 |
57,700 |
180,500 |
|
20–40/mo |
334 |
69,800 |
223,250 |
|
40+/mo |
180 |
52,000 |
123,500 |
Gaming audiences expect regular, frequent content. Let's Plays, reviews, and reaction formats have low production overhead and high consumption frequency. If you run a gaming channel in this size range, posting 5+ times per week with consistent spacing is the data-backed approach.
What should gaming channels do?
Post 5–10 times per week. Keep your gaps consistent — the audience habit you're building is as important as the volume itself. Track your consistency score monthly. Gaming is the one niche where a high score at high volume is the actual goal.
What's the Best Posting Frequency for Science and Tech Channels?
Science & Tech shows the opposite pattern from Gaming. The sweet spot is 2–5 videos per month — 110,000 median subscribers. Post too little or too much, and performance drops to roughly 50,000. Tech audiences subscribe for expertise. Spreading that thin across too many videos costs subscribers.
|
Freq bucket |
Channels |
Median subs |
Top 25% |
|---|---|---|---|
|
<2/mo |
115 |
52,500 |
152,500 |
|
2–5/mo |
165 |
110,000 |
304,000 |
|
5–10/mo |
134 |
96,100 |
251,250 |
|
10–20/mo |
98 |
108,500 |
282,500 |
|
20–40/mo |
60 |
53,200 |
167,750 |
|
40+/mo |
29 |
49,800 |
176,000 |
Tech content — reviews, tutorials, deep dives — typically takes longer to produce and rewards depth. Spreading resources thin across high upload volume erodes the quality signals the algorithm reads.
What should tech channels do?
Default to 2–5 videos per month. Focus production time on depth — longer, more complete videos outperform frequent shorter ones in this niche. The 5–10/mo range can work if you can hold the depth, but the data doesn't support pushing beyond that.
What's the Ideal Posting Frequency for Food and Cooking Channels?
Food & Drink channels peak at 5–10 videos per month — about 1–2.5 per week — with a median of 136,000 subscribers. Performance drops in both directions: 2–5/mo averages 88,950, while 40+/mo drops to 60,000.
|
Freq bucket |
Channels |
Median subs |
Top 25% |
|---|---|---|---|
|
2–5/mo |
96 |
88,950 |
351,250 |
|
5–10/mo |
103 |
136,000 |
362,000 |
|
10–20/mo |
81 |
82,100 |
202,000 |
|
40+/mo |
16 |
60,000 |
109,375 |
Food content has a natural cadence — recipe videos are repeatable, moderately quick to produce, and evergreen. The sharp drop above 10–20/mo suggests over-posting competes against the channel's own content rather than growing the audience.
What should cooking channels do?
Aim for 1–2 videos per week and hold that schedule consistently. The sweet spot here is narrow — going above 10–20/mo is where the data starts to punish you.
How Often Should Fitness Channels Post on YouTube?
The biggest over-posting penalty in the dataset goes to Health & Fitness. Channels posting 2–5 times per month average 172,000 subscribers. Push to 10–20/mo, and that drops to 77,700 — less than half. Fitness audiences follow channels they trust. Post too much, and that trust erodes. This is also the niche where watch time per video most directly determines whether the algorithm recommends you.
|
Freq bucket |
Channels |
Median subs |
Top 25% |
|---|---|---|---|
|
<2/mo |
53 |
68,100 |
189,000 |
|
2–5/mo |
82 |
172,000 |
399,250 |
|
5–10/mo |
114 |
120,000 |
394,750 |
|
10–20/mo |
63 |
77,700 |
258,500 |
Fitness content — workout programs, nutritional guidance, transformation stories — performs on depth and trust. Viewers subscribe to channels they follow, not channels they simply sample. Frequent low-effort uploads appear to erode that trust signal.
What should fitness channels do?
Post 2–5 times per month and protect the depth of every video. The 5–10/mo range still performs well if you can hold quality — but anything above that is where the penalty kicks in hard.
Feel like your channel should be growing faster?
That feeling is usually data. Something in your mechanics is capping the growth — and it's rarely obvious from inside your own Studio. We've diagnosed this across 3,000+ channels and will tell you exactly what to fix first.
Find what's holding you backHow Often Should Beauty YouTubers Post?
Beauty is the one niche where posting more consistently pays off at the top end. Channels posting 10–20 videos per month have the highest median subscribers — 177,000 — and the top 25% of those channels reach 878,000 subscribers. That's the highest ceiling in the entire beauty dataset.
There are only 19 channels in our dataset that post at that rate. These are likely established creators with a full production setup. For most beauty channels, 2–5 videos per month is a strong and sustainable starting point — and it still outperforms posting too little or too much.
|
Freq bucket |
Channels |
Median subs |
Top 25% |
|---|---|---|---|
|
<2/mo |
38 |
76,050 |
266,750 |
|
2–5/mo |
72 |
169,000 |
622,500 |
|
5–10/mo |
52 |
147,000 |
546,750 |
|
10–20/mo |
19 |
177,000 |
878,000 |
|
20–40/mo |
12 |
143,000 |
235,500 |
What should beauty channels do?
Start with 2–5 videos per month. If production capacity allows you to scale to 3–4 per week sustainably, the data suggests top performers do reach those levels. The drop-off among top performers at 20–40/mo shows that forcing high volume without matching quality creates a ceiling.
How Often Should Travel Vloggers Post on YouTube?
For travel channels, posting frequency barely matters. The difference between the best and worst posting schedules is under 7,000 subscribers. Post 2–5 times per month, but don't stress the number — consistency and video quality matter more here than how often you upload.
|
Freq bucket |
Channels |
Median subs |
Top 25% |
|---|---|---|---|
|
<2/mo |
91 |
58,100 |
162,500 |
|
2–5/mo |
138 |
60,250 |
184,750 |
|
5–10/mo |
109 |
52,200 |
177,000 |
|
10–20/mo |
83 |
55,900 |
193,500 |
|
40+/mo |
13 |
53,600 |
95,000 |
Travel content is inherently production-constrained. The flat curve reflects this reality: the algorithm adjusts for niche norms, and travel audiences understand slower cadences. The priority here is visual quality and consistency of scheduling, not upload volume.
What should travel channels do?
Post 2–5 times per month and hold the schedule. Don't chase frequency — it won't move the needle. Focus on production quality and metadata optimization, which are the stronger levers in this niche.
What's the Best Upload Frequency for DIY and Home Channels?
Same story as fitness: 2–5 videos per month win, and over-posting hurts. Channels that sacrifice depth for volume lose subscribers. Make fewer, better videos.
|
Freq bucket |
Channels |
Median subs |
Top 25% |
|---|---|---|---|
|
<2/mo |
116 |
83,050 |
314,000 |
|
2–5/mo |
178 |
114,000 |
321,500 |
|
5–10/mo |
130 |
105,000 |
321,250 |
|
10–20/mo |
87 |
90,700 |
260,500 |
Top performers exist at both cadences — the subscriber ceiling for 2–5/mo and 5–10/mo is nearly identical. The deciding factor is production quality, not upload count. The deciding factor should be production quality, not pushing to maximize volume.
The aggregate data masks something important, though. We worked with a DIY channel that saw total views fall 9% in one period — a platform traffic slowdown — while revenue still grew 20%. Uploads stayed regular throughout. The channel didn't change its posting frequency. It changed what was behind each video:
- Longer runtime (20–25 min shifted to 25–30+)
- Stronger thumbnails
- And metadata translated across 50+ languages.
- Watch time grew 7.6% — 18,206 extra hours — despite fewer total views.
- The algorithm rewarded the depth signal, not the volume. Full case here.
What should DIY channels do?
Post 2–5 times per month and protect the depth. Either 2–5/mo or 5–10/mo works at the top — focus on watch time per video, not upload count.
How Often Should Business and Finance YouTubers Post?
Business channels peak at 10–20 videos per month — 106,000 median subscribers. Push past that, and performance drops fast. Channels posting 20–40/mo average only 64,100. Business content requires credibility, and that's hard to maintain at high volume.
|
Freq bucket |
Channels |
Median subs |
Top 25% |
|---|---|---|---|
|
2–5/mo |
81 |
93,400 |
262,000 |
|
5–10/mo |
80 |
88,100 |
271,000 |
|
10–20/mo |
67 |
106,000 |
223,500 |
|
20–40/mo |
36 |
64,100 |
231,500 |
|
40+/mo |
21 |
79,400 |
161,000 |
Posting 30 videos per month is difficult without visibly diluting quality, and audiences notice. The 10–20/mo sweet spot gives enough volume to maintain algorithmic momentum while preserving the production standard that drives subscription.
What should business channels do?
Aim for 2–5 per week. The data supports going up to 10–20/mo if you can hold the depth — but the sharp drop at 20–40/mo shows exactly where quality erosion begins to cost you.
What's the Best Posting Frequency for Entertainment Channels?
Entertainment channels have the flattest curve in the dataset. It almost doesn't matter how often you post, as long as you post at least 2–5 times a month. Format and content quality drive results here, not frequency. For entertainment channels specifically, how often you post Shorts can matter as much as long-form cadence.
|
Freq bucket |
Channels |
Median subs |
Top 25% |
|---|---|---|---|
|
<2/mo |
614 |
59,500 |
189,250 |
|
2–5/mo |
543 |
76,200 |
264,000 |
|
5–10/mo |
474 |
73,650 |
234,250 |
|
10–20/mo |
373 |
75,100 |
219,000 |
|
20–40/mo |
281 |
66,700 |
164,000 |
|
40+/mo |
150 |
65,600 |
158,500 |
Entertainment is a broad category, and the flat curve reflects that diversity. The format matters more than frequency — a sketch comedy channel and a commentary channel have very different production rhythms. The consistent signal: posting fewer than twice per month underperforms. Beyond that, the data doesn't strongly favor one frequency over another.
That said, when consistency and rhythm are actually built in, the results can be dramatic. We worked with a Canadian entertainment channel at 11,000 subscribers with flat growth. Publishing frequency increased by more than 100% — 176 additional videos over the quarter — alongside a structured Shorts strategy. Total views grew 268%, watch time grew 624%, and revenue grew 55% month-over-month in the two months following the intervention. The key wasn't the volume alone. It was the rhythm:
- Сonsistent upload times.
- Shorts supporting long-form themes.
- Each piece reinforces the next.
- Full case here.
What should entertainment channels do?
Post at least 2–5 times per month and keep the schedule. Beyond that, let format and production capacity guide the cadence. The algorithm in entertainment responds more to packaging and watch time than to raw frequency.
Posting at the right frequency but still not growing?
Frequency is one dimension. Packaging, retention, and traffic routing matter just as much — and they're hard to diagnose from inside your own Studio. We've found the real blockers across 3,000+ channels; let us fund yours. → Get the diagnosis.
How Often Should Kids' and Animation Channels Post?
High volume wins for kids' channels. 20–40 videos per month lead with 76,600 median subscribers and the highest subscriber ceiling in the niche. The middle range (5–20/mo) actually underperforms. Either go high volume or keep it low and consistent. The in-between doesn't work. For a broader breakdown of what drives kids' channel growth beyond frequency, see our guide on growing a kids' YouTube channel.
|
Freq bucket |
Channels |
Median subs |
Top 25% |
|---|---|---|---|
|
<2/mo |
55 |
50,500 |
139,000 |
|
5–10/mo |
63 |
48,800 |
170,500 |
|
10–20/mo |
72 |
42,400 |
119,000 |
|
20–40/mo |
58 |
76,600 |
372,250 |
Kids' content is often catalog-driven — parents put a channel on repeat, and a larger library creates more watch time and more algorithmic distribution. High-volume posting builds that catalog faster. If you're producing kids' content and can maintain quality at 5–10 uploads per week, the data supports it.
The aggregate data obscures some of the strongest results we've seen. We worked with a multilingual kids' channel network across 8 language versions. The same recommendation was applied across all 8:
- Increase upload frequency consistently.
- Every single channel grew — no exceptions.
- Views grew between +5% and +70% per language channel, and revenue between +3% and +79%.
- In Vietnamese and Portuguese markets, revenue grew 2–3× faster than views — the channels were undermonetized relative to their audience quality, and the cadence increase unlocked the gap.
A separate partner, a kids' channel with 7.5M subscribers, published 23 Shorts in a quarter where it had published zero — simultaneously cutting long-form output from 21 to 11 videos. Views grew 5.5%. Revenue grew 33.6% — 6× faster than views — because more regular publishing combined with better format balance sent cleaner watch-time signals to the algorithm. Full case here.
What should kids' channels do?
Aim for 20–40 videos per month if production capacity allows. If it doesn't, post low and consistently — the middle range (5–20/mo) is where the data shows the weakest performance. Don't get stuck there.
How Often Should Education Channels Post on YouTube?
Quality over quantity clearly wins for education channels. 2–5 videos per month peak at 116,000 subscribers. Push above 20/mo, and performance falls sharply.
|
Freq bucket |
Channels |
Median subs |
Top 25% |
|---|---|---|---|
|
2–5/mo |
35 |
116,000 |
272,500 |
|
5–10/mo |
35 |
114,000 |
224,500 |
|
10–20/mo |
40 |
108,500 |
262,750 |
|
20–40/mo |
18 |
58,100 |
286,250 |
|
40+/mo |
6 |
63,750 |
89,425 |
The 5–10/mo range also performs nearly as well (114,000), giving flexibility if you can maintain depth at that pace. Rapid-fire uploads at lower quality erode the relationship.
That said, the aggregate data doesn't capture the damage that over-posting can do when paired with wrong execution. We worked with a legal education channel targeting a 60+ audience that was publishing 386 videos in one period. Revenue was $743. We:
- Restructured metadata for intent
- Simplified scripts for the audience
- and rebuilt the retention mechanics.
The channel then published 165 videos in the next period — 57% fewer. Revenue grew 141%. Watch time grew 175%. Subscribers grew 224%. The algorithm started recommending the channel more aggressively because each video was satisfying viewers more completely. Watch time more than doubled on 57% fewer uploads. Full case here.
What should education channels do?
Post 2–5 times per month and protect the depth of every video. The 5–10/mo range works if you can maintain quality. Anything above 20/mo is where the data shows sharp underperformance — don't push into it without a clear production system behind it.
The Posting Frequency Recommendation Matrix
Use this as your starting point. Consistency priority indicates how much irregular spacing hurts relative to maintaining the right average volume.
|
Niche |
Min videos/week |
Optimal videos/week |
Consistency priority |
Note |
|---|---|---|---|---|
|
Gaming |
2/week |
5–10/week |
High |
Volume is the norm in this niche |
|
Kids & Animation |
2/week |
5–10/week |
High |
Library size drives catalog watch time |
|
Beauty |
1/week |
2–5/week |
High |
Top performers are at 3–4/week |
|
Business |
1/week |
2–5/week |
High |
Drops off sharply above 5/week |
|
Food & Drink |
1/week |
1–2.5/week |
Medium |
The sweet spot is consistent mid-range |
|
Entertainment |
0.5/week |
0.5–1.5/week |
Medium |
Format matters more than frequency |
|
Home & DIY |
0.5/week |
0.5–1.5/week |
Medium |
Quality per video drives performance |
|
Science & Tech |
0.5/week |
0.5–1.5/week |
High |
Depth outperforms volume |
|
Education |
0.5/week |
0.5–1.5/week |
High |
Over-posting hurts significantly |
|
Health & Fitness |
0.5/week |
0.5–1.5/week |
High |
The largest performance penalty for over-posting |
|
Travel |
0.25/week |
0.5–1.5/week |
Medium |
Production-constrained niche; quality first |
"Consistency priority" = how much irregular spacing hurts relative to the right average. High priority means erratic posting at the correct average frequency still underperforms consistent posting at a slightly lower count.
Key Takeaways for Creators
- There is no universal answer — but there are niche answers. Gaming and Kids reward high volume. Health, Education, Science, and DIY reward depth and regularity. Know which niche you're in before setting an upload schedule.
- Consistency of intervals beats volume. Channels with regular, predictable spacing between uploads outperform erratic channels posting the same number of videos per month. Pick a schedule and hold it.
- Over-posting is a real risk in most niches. In Health & Fitness, Science & Tech, Education, and Business, posting above the optimal frequency correlates with meaningfully lower subscriber counts. More is not always better.
- Breaks hurt most in high-frequency niches. Gaming and Kids channels are most sensitive to gaps of 14+ days. Science, Education, and Travel show much more resilience to planned breaks.
- The floor matters. In every niche, channels posting fewer than 2 videos per month underperform the median. Some activity is always better than near-inactivity.
The data from 18,000 channels tells a clear story: optimal posting frequency is niche-specific, consistency matters as much as volume, and over-posting is a real and measurable risk in most categories. Gaming and kids' entertainment are the exceptions — they genuinely reward high upload cadence. Every other niche peaks at 2–10 videos per month. If you're hitting a wall despite posting consistently, the issue is rarely frequency — it's more likely one of the other dimensions covered in our channel growth plateau guide.
So… What Does Your Channel Need?
Knowing the right posting range for your niche is useful. But it probably won't tell you why a channel in your niche posts half as often and still outperforms yours, or why you're already inside the optimal range and still not growing.
Frequency is one dimension. There are nine others — packaging, retention, traffic source split, competitor positioning, format mix, revenue structure, audience behavior, risk signals, growth ceiling. Most channels have two or three things broken across those dimensions that are invisible from the inside.
That's what the AIR Expert Audit does. Our team of 200+ strategists — backed by deep Studio access to 3,000+ channels, a 450K-channel training dataset, 1 trillion views analyzed, and 21 in-house AI diagnostic tools — dissects your channel across all 10 angles and hands you a plan specific to your situation, not a generic checklist.
What you get:
- A structured report across 10 performance pillars: packaging, retention, traffic sources, competitor gaps, format mix, revenue structure, audience behavior, risk signals, growth projection, and a ranked roadmap
- A 30-day action plan ranked by impact — what to fix first, and what each move should move
- A 45–60-minute live walkthrough with a senior AIR strategist to unpack the findings and answer every question

