



Whether streaming is worth it depends on your niche more than on anything else you control. In our data, a crafting channel earns a median $91 for every hour it streams, while a music channel earns 35 cents. So before you copy someone else’s streaming strategy, look up what the format pays where you are. We measured it: 404 real channels across 11 niches, a full year of YouTube Analytics data, 127 of those channels earning money from live content. To put it simply – a stream view out-earns a video view in 8 of 11 niches we could measure. The idea that “streams pay less” comes from creators in the other three.
This is the niche companion to our general streaming study, which covers how often to stream, how long, in which season, and what happens to your regular videos. Here, every niche gets its own profile: a stat card with its numbers, the size and revenue math behind them, and what real channels earned when they got the format right. All formats side by side are in our YouTube monetization overview for 2026.
About This Study
This breakdown runs on the same dataset as our general streaming study: 404 channels, followed across all twelve months of 2025 in YouTube Analytics. That's 3,893 channel-months, 1,287 of them live months from the 127 channels that earned money streaming.
Figures are medians throughout. Revenue counts ad money after YouTube's share; Super Chats and memberships come on top of every number here.
Sample sizes differ by niche – rows marked with an asterisk rest on a few channels each, so read them as strong signals rather than settled benchmarks.
Which Niches Pay More Per Stream View Than Per Video View?
Eight of eleven. And the pattern is simple once you see it: streams pay best exactly where videos pay worst.
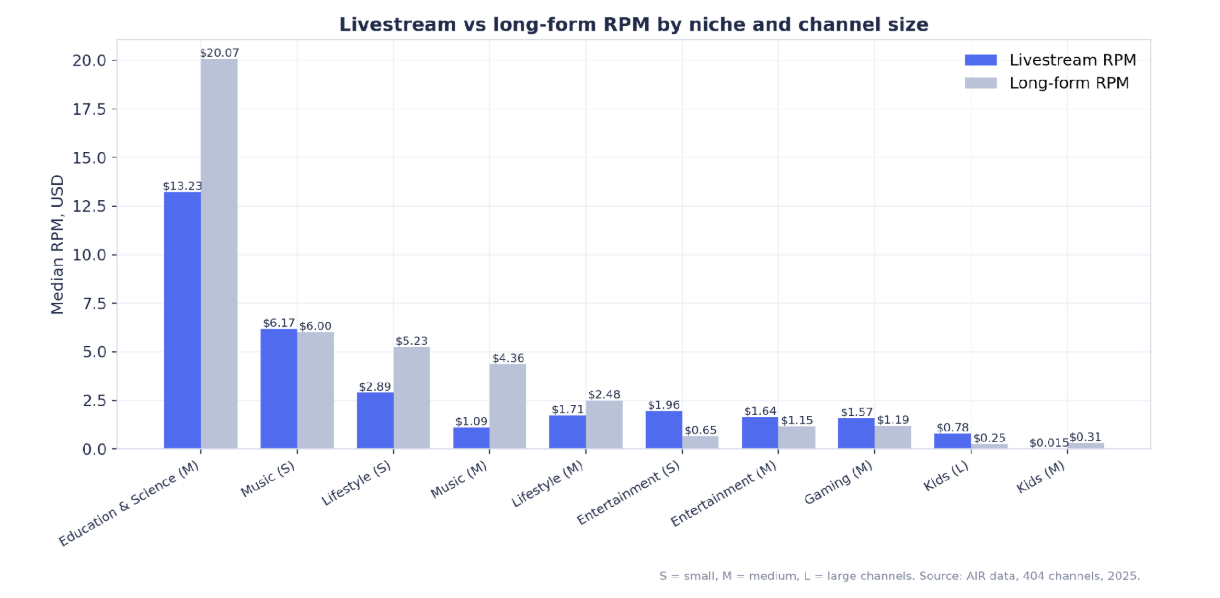
Livestream RPM vs video RPM by niche
All eleven niches, from the highest live RPM down.
|
Niche |
Live RPM |
Video RPM |
Live pays… |
$ per hour streamed |
1 stream = … uploads of watch time |
|
Education & Science |
$17.58 |
$21.48 |
0.8x |
$7.33 |
1.4 |
|
Transport* |
$14.85 |
$5.23 |
2.8x |
$165.90 |
5.1 |
|
Crafting & DIY* |
$9.28 |
$2.61 |
3.6x |
$91.33 |
1.0 |
|
Music |
$6.17 |
$6.00 |
1.0x |
$0.35 |
1.1 |
|
Business & Finance* |
$4.66 |
$5.19 |
0.9x |
$2.20 |
0.55 |
|
Food* |
$4.50 |
$4.17 |
1.1x |
$0.86 |
0.8 |
|
Lifestyle |
$3.80 |
$4.08 |
0.9x |
$1.97 |
0.3 |
|
Entertainment |
$2.70 |
$1.03 |
2.6x |
$9.85 |
0.55 |
|
Gaming |
$2.49 |
$1.15 |
2.2x |
$0.68 |
0.35 |
|
Gadgets & Tech* |
$2.33 |
$0.71 |
3.3x |
$0.56 |
0.06 |
|
Kids & Teens |
$1.45 |
$0.43 |
3.4x |
$1.06 |
0.7 |
All medians across the streaming channels of each niche, 2025. RPM = revenue per 1,000 views, after YouTube’s cut. Watch-time equivalence compares a median stream to a median upload on the same channels, over monetized months. Asterisks mark small samples.
In the niches where video ads are cheap (Kids, Gadgets, Entertainment, Gaming), a stream view pays two to three times more than a video view. Live ads plus longer viewing raise the floor under low-value traffic.
In the niches where video ads are premium (Education, Business, Lifestyle), streams pay a touch less per view, around 80–90% of the video rate. But “a touch less” of a premium rate is still a premium rate: Education streams earn $17.58 per 1,000 views, the highest live rate of any niche.
So the “streams pay pennies” belief is really a niche accident. If you heard it from a lifestyle vlogger, it was true for them. It would be false for the gaming channel next door.
How much you can earn with streams??
Niche medians set the starting point, but your catalog, regions, and upload schedule move the number a lot. AIR’s specialists have audited 3,000+ channels and can tell you what streams would earn on yours→ Get the numbers.
Three Patterns That Run Through Every Niche
The profiles below repeat three findings so often that it’s worth naming them once, up front.
Every niche splits into experimenters and residents. Typical live revenue shares look tiny next to top-quarter shares: large kids’ channels sit at 0.5% at the median while their top quarter runs above 81%, small entertainment channels at 14.2% against 93%+.
The medians describe channels that poke at the format; the top quarters describe channels that moved in. Both numbers appear in the profiles, and the distance between them is the size of the opportunity.
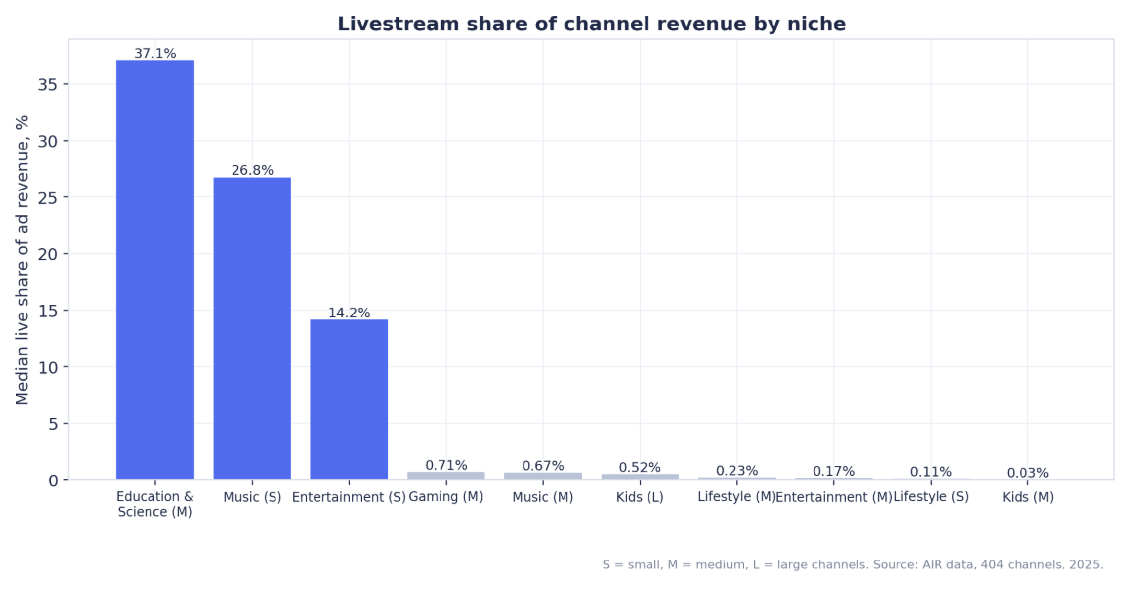
Live share of channel ad revenue, by niche and size
Channel size changes less than niche does. The live-RPM premium in cheap-ad niches holds from 10K subscribers to 10M, so nobody has to grow into it. The one hard exception is Kids & Teens, where made-for-kids policy splits medium channels from large ones; the Kids profile shows both sides of that line.
Live viewers subscribe slightly less readily than video viewers (1.77 against 2.44 per 1,000 views), except in Gadgets, Kids, and Transport, which flip it. Each profile lists its own conversion pair, because the niche rate decides whether streams can be a growth tool or only a revenue tool.
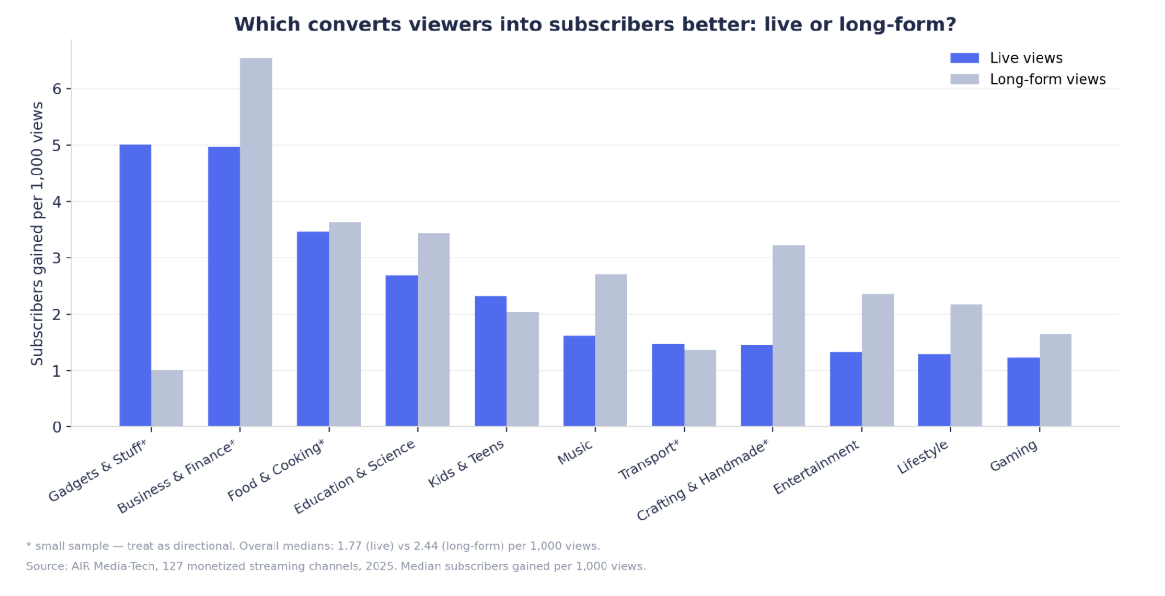
Subscribers per 1,000 views: live vs video, by niche
Livestreams by Niche: the Detailed Breakdown
The table above tells you where your niche ranks. The profiles below tell you why it ranks there, what streaming style works in it, and what real channels earned when they got it right.
- Gaming
- Entertainment
- Music
- Kids & Teens
- Education & Science
- Lifestyle
- Crafting & DIY
- Transport
- Business, Food, Gadgets, News
Gaming
|
What we measured |
Gaming |
|
Views per stream |
8 |
|
Live RPM vs video RPM |
$2.49 vs $1.15 (2.2x) |
|
Ad revenue per streamed hour |
$0.68 |
|
One stream’s watch time |
0.35 of an upload |
|
Subs per 1,000 views, live vs video |
1.23 vs 1.65 |
|
Live revenue share, typical → committed |
0.7% → 37.7% at 8+ streams |
Medians, 2025. Typical share measured on medium channels (100K–1M), gaming’s best-sampled segment.
Eight viewers. That’s the median gaming stream, on channels whose regular videos pull tens of thousands of views. Between those two numbers sits the whole niche verdict: almost nobody watches the typical gaming stream, and the format still pays, because gaming videos earn a famously low $1.15 RPM while gaming streams earn $2.49. The premium survives the size split too – medium gaming channels earn 1.32x per live view.
Grinding manual streams for ad money makes little sense at $0.68 an hour. What makes sense is scale: gaming catalogs (walkthroughs, funny moments, compilations) loop into 24/7 broadcasts better than almost any content on YouTube, and frequency moves every gaming number at once.
Live subscribers climb from a median 1.5 a month at one stream to 11.5 at 2–3, 23 at 4–7, and 134 at 8+ – where live also carries 27.9% of all new subscribers, a median $270.45 a month, and 37.7% of the channel’s ad revenue, up from a 0.7% typical share. If you’d rather optimize your own hours than the channel’s totals, the per-hour conversion peak sits at 2–3 streams a month: event streams, promoted like releases.
Our data adds one reassuring detail. Gaming channels that stream heavily have better-performing regular videos than light streamers: 50,884 median views per video against 36,729. Streaming sits on top of a gaming channel, and the channel doesn’t sag under it.
StrEat, a 2.8M-subscriber gaming channel, put four simultaneous 24/7 streams on its 239-video catalog. Partner income multiplied five times. Streams now bring 83% of watch hours and 80% of yearly revenue, at the highest RPM of any format on the channel.
Turn your catalog into the broadcast
The channels winning in Gaming, Music, and Kids stream videos they already published, in loops that never go offline. Gyre runs the whole setup (scheduling, looping, optimization) and was voted streaming Product of the Year 2025. → Put your catalog on air.
Entertainment
|
What we measured |
Entertainment |
|
Views per stream |
48 |
|
Live RPM vs video RPM |
$2.70 vs $1.03 (2.6x) |
|
Ad revenue per streamed hour |
$9.85 |
|
One stream’s watch time |
0.55 of an upload |
|
Subs per 1,000 views, live vs video |
1.33 vs 2.36 |
|
Live revenue share, typical → top quarter |
14.2% → 93.7%+ (small channels) |
Medians, 2025.
Entertainment streams pay 2.6 times the niche’s video rate and earn $9.85 per streamed hour, the best figure among the well-sampled niches. The premium holds at every channel size (small channels get 3.01x per view, medium ones 1.43x), so the advantage is structural, and no niche has more documented wins among the channels we work with.
A typical small entertainment channel takes 14.2% of its income from live, while the committed top quarter runs above 93% — the widest experimenter-to-resident gap in the study outside Kids. For small channels the format can become the growth engine outright: the ones that pushed to 8+ streams a month drew a median 75% of all their new subscribers from live content. That’s a channel growing through its broadcasts while its uploads do the brand-building.
An entertainment channel added 24/7 streams and changed nothing else about its uploads: six months later, stream revenue had grown from $30.68 to $1,269.41 a month, and its regular videos gained 23.6% more views on top.
Music
|
What we measured |
Music |
|
Views per stream |
34 |
|
Live RPM vs video RPM |
$6.17 vs $6.00 (1.0x) |
|
Ad revenue per streamed hour |
$0.35 |
|
One stream’s watch time |
1.1 uploads |
|
Subs per 1,000 views, live vs video |
1.62 vs 2.71 |
|
Live revenue share, typical → committed |
26.8% → 85.1% at 8+ streams (small channels) |
Medians, 2025.
Music has the largest group of streaming channels in our sample (25) and the scariest-looking number: $0.35 per streamed hour. It also has live RPM at full parity with videos ($6.17 vs $6.00, the second-highest live rate anywhere).
The contradiction resolves once you see how music streams: as always-on radio, with some broadcasts running around the clock – medium music channels in one group averaged 50 hours per stream. Massive hours, modest rate per hour, solid monthly total. And small music channels are already the second most live-committed group in the data, with a typical 26.8% of ad income arriving through streams.
The size table in the general study shows medium music channels at an ugly 0.25x live-to-video ratio, and the same radio logic explains it: live revenue spread over radio-scale hours and views collapses the per-view rate at the median. Watch what happens when those channels commit instead:
|
At 8+ streams a month |
Small (10K–100K) |
Medium (100K–1M) |
|
Live RPM |
$11.44 |
$11.53 |
|
Live revenue per month |
$123.76 |
$202.78 |
|
Live share of ad revenue |
85.1% |
22.8% |
|
Live share of new subscribers |
66.4% |
25.5% |
Medians across months with 8+ streams, 2025.
Committed music streamers earn some of the highest live rates in the dataset – the $11.53 RPM at 8+ streams nearly doubles the niche median. Small music channels effectively become radio stations: 85% of revenue and two-thirds of new subscribers arrive through live.
Music channels stream in their seasonally slow months, around concerts and holidays, so their video views look worse in streaming months. That’s the calendar, and the schedule. In those same months, their total watch time nearly tripled.
A lounge-music channel used themed holiday 24/7 streams and localized metadata to keep about 79% of its pre-holiday revenue through the January–March slump – in a category where losing 40–60% is normal. One holiday stream brought over 11% of its Q1 revenue
Kids & Teens
|
What we measured |
Kids & Teens |
|
Views per stream |
75 |
|
Live RPM vs video RPM |
$1.45 vs $0.43 (3.4x) |
|
Ad revenue per streamed hour |
$1.06 |
|
One stream’s watch time |
0.7 of an upload |
|
Subs per 1,000 views, live vs video |
2.32 vs 2.04 (one of three niches where live wins) |
|
Live revenue share, typical → committed |
0.5% → 96.6% at 8+ streams (large channels) |
Medians, 2025.
Kids’ content pays the worst video rates on YouTube, and streams fix more of that here than anywhere else: a kids’ stream view pays 3.4 times a kids’ video view, the biggest live advantage in the data. Kids is also one of the few niches where live viewers subscribe better than video viewers.
At full commitment, the numbers dwarf every other niche. Large kids’ channels streaming 8+ times a month earn a median $2,531.93 from live (96.6% of their ad revenue) and gain about 9,767 subscribers a month from streams, which is 90.6% of all their growth. The format behind those numbers is industrial: at the highest frequencies, a kids’ “stream” averages 745 minutes – a half-day broadcast rather than a session in front of a camera.
The gate is made-for-kids designation – it limits ad formats and turns off live chat, and it hits smaller channels hardest.
Medium kids’ channels earn a near-zero $0.02 live RPM at the median, while large ones earn a 3.1x premium over their videos. But even the medium tier isn’t sealed shut – the medium kids’ channels that pushed to 8+ streams a month earned a median $95.85 from live at an 85.8% revenue share, and live brought them 144 subscribers a month, 57.1% of their growth. Scale and content mix decide which side of the gate you’re on, so check before you commit.
To prove the point even further, here are some real-life wins from channels AIR works with directly.
- DONA English (5.2M subs) launched four 24/7 streams in August; by September, live had gone from 20% to 60% of channel revenue, with total views up 42%.
- Heidi dan Zidane (15.8M subs) gets 41.9% of its watch time from streams that take under 20% of its views, at a live RPM 66% above its uploads.
Education & Science
|
What we measured |
Education & Science |
|
Views per stream |
196 |
|
Live RPM vs video RPM |
$17.58 vs $21.48 (0.8x) |
|
Ad revenue per streamed hour |
$7.33 |
|
One stream’s watch time |
1.4 uploads |
|
Subs per 1,000 views, live vs video |
2.69 vs 3.44 |
|
Live revenue share, typical |
37.1% ($457.50 a month) — the highest median anywhere |
Medians, 2025. Education’s revenue figures come from its medium segment (100K–1M), the best-sampled one.
Education is the best-paying video niche on YouTube, and it turns out the advertisers come along when the content goes live: $17.58 per 1,000 live views, almost double the next niche. Education streams also draw the second-biggest live crowds in the study, 196 median views per stream, behind only Transport.
The typical education streamer already earns 37.1% of ad revenue from live, the highest share anywhere, at $457.50 a month – and the top quarter of education months runs above 64% live. No other niche has normalized streaming to this degree; what reads as a ceiling elsewhere reads as a routine here.
An education stream produces more watch time than an upload does (about 1.4 uploads’ worth), live brings education streamers a median 24.7% of their new subscribers, and the channels at 8+ streams a month log around 3.7 million minutes of live watch time monthly – a second channel’s worth of viewing.
An English-teaching creator ran two streams himself, then handed the setup over. Ten streams later: 111,053 stream views, 793 new subscribers, and 2.43% added to channel income, in a few weeks, without new content .
Lifestyle
|
What we measured |
Lifestyle |
|
Views per stream |
19 |
|
Live RPM vs video RPM |
$3.80 vs $4.08 (0.9x) |
|
Ad revenue per streamed hour |
$1.97 |
|
One stream’s watch time |
0.3 of an upload |
|
Subs per 1,000 views, live vs video |
1.29 vs 2.17 |
|
Video views in streaming months |
+7.2% — the only group that grew |
Medians, 2025.
Lifestyle’s live economics are ordinary: 90% of the video rate per view, $1.97 per hour, below-average conversion, and the per-view rate stays under the video rate at both sizes we measured (0.55x small, 0.69x medium). Nobody streams in lifestyle for the RPM.
What earns the niche a full profile is what happened to its regular videos. Lifestyle is the one group in our same-channel comparison whose videos got more views in streaming months – 24,052 per video against 22,432, up 7.2%. Those channels streamed about 7 times a month while raising their upload pace from a median 9 videos to 27.5, and the whole channel grew: monthly watch time in streaming months ran seven times higher than in quiet months, 7.3 million viewer-minutes against 1 million.
That’s the lesson other niches should borrow. Stream on top of your schedule, never instead of it, and the formats reinforce each other.
Crafting & DIY
|
What we measured |
Crafting & DIY |
|
Views per stream |
71 |
|
Live RPM vs video RPM |
$9.28 vs $2.61 (3.6x) |
|
Ad revenue per streamed hour |
$91.33 |
|
One stream’s watch time |
1.0 upload |
|
Subs per 1,000 views, live vs video |
1.45 vs 3.22 |
|
Streaming channels in the sample |
5 — hold the numbers loosely |
Medians, 2025.
Five streaming channels, so treat this profile as a strong signal rather than a settled verdict. But every number in it is loud: $9.28 live RPM against $2.61 for videos (3.6x, the second-biggest advantage in the data), $91.33 per streamed hour, and stream watch time roughly equal to upload watch time, minute for minute.
A crafting live view subscribes at less than half the video rate (1.45 against 3.22 per 1,000), so streams here are a monetization play more than a growth play – the growth keeps coming from uploads while the broadcasts collect the money.
Lesnoy (393K subs) launched a single 24/7 stream and collected 1.15M views, 260K watch hours, and 2,000+ subscribers in two months.
Transport
|
What we measured |
Transport |
|
Views per stream |
3,814 |
|
Live RPM vs video RPM |
$14.85 vs $5.23 (2.8x) |
|
Ad revenue per streamed hour |
$165.90 |
|
One stream’s watch time |
5.1 uploads |
|
Subs per 1,000 views, live vs video |
1.47 vs 1.37 (live wins) |
|
Live subscribers per month |
98 — the highest raw count in the data |
Medians, 2025. Three channels; every row is a caveat.
Everything about transport streaming comes with a three-channel caveat, and everything about it is extreme. The median transport stream draws 3,814 views – twenty times the next niche and almost 500 times the median gaming stream. Each streamed hour pays $165.90, each stream carries the watch time of five uploads (the highest ratio in the study), live viewers subscribe slightly better than video viewers, and the niche collects a median 98 live subscribers a month, the biggest raw haul anywhere in the sample.
Long-haul, ambient, machine-driven content appears to be built for the live format. If you run a transport channel, you may be sitting on the best unexplored streaming economics on YouTube. Test it before your competitors read this table.
Business, Food, Gadget, News
Too few streaming channels for settled medians, so here are the early signals side by side:
|
What we measured |
Business & Finance |
Food & Cooking |
Gadgets & Tech |
|
Streaming channels |
4 |
2 |
2 |
|
Views per stream |
142 |
30 |
21 |
|
Live RPM vs video RPM |
$4.66 vs $5.19 (0.9x) |
$4.50 vs $4.17 (1.1x) |
$2.33 vs $0.71 (3.3x) |
|
Ad revenue per streamed hour |
$2.20 |
$0.86 |
$0.56 |
|
Subs per 1,000 views, live vs video |
4.97 vs 6.54 |
3.47 vs 3.63 |
5.01 vs 1.01 |
Medians, 2025. All three columns are signals to test, not benchmarks to plan around.
Business & Finance draws respectable live crowds (142 views per stream, third in the study) at near-video rates, and business viewers subscribe at the second-highest rate anywhere, live or not. Food shows a slight live premium and strong conversion on both formats. Gadgets & Tech is the wild card: a 3.3x live RPM advantage and a 5x subscriber conversion edge, both from 22 channel-months – file under “promising, unconfirmed.”
News didn’t have enough monetizing live channels for a table column, but AIR’s case have enough data to give you an idea. A 2.2M-subscriber news channel we worked with paired 24/7 streams with restoring 41 demonetized videos and grew revenue 32% in one month, with profit up 49%. News runs on live attention by nature; the format fits.
The Short Version, Niche by Niche
|
Niche |
The verdict |
|
Gaming |
Don’t stream for hourly pay; loop your catalog 24/7. At 8+ streams: $270/mo, 37.7% of revenue, 134 subs a month. |
|
Entertainment |
Best all-around: 2.6x per view, $9.85/hr, the premium holds at every size, and the deepest case file. |
|
Music |
Run radio and judge it monthly. Committed streamers hit an $11.53 RPM; small channels take 85% of revenue live. |
|
Kids & Teens |
The biggest ceiling in the study ($2,532/mo at 96.6% share) — if scale and made-for-kids rules are on your side. |
|
Education & Science |
Premium rates follow you live: $17.58 RPM, 37.1% revenue share, a quarter of new subs. The most mature streaming niche. |
|
Lifestyle |
Ordinary rates, priceless example: stream on top of uploads and both grow (+7.2% video views, 7x watch time). |
|
Crafting & DIY |
3.6x per view, $91/hr, nearly zero competition. The sleeper. |
|
Transport |
Extreme everything on three channels: 3,814 views, $166/hr, five uploads of watch time per stream. Test it now. |
|
Business, Food, Gadgets |
Early signals, small samples: parity or better per view, strong conversion. Watch this space. |
|
News |
No table row, but the case evidence (32% revenue, 49% profit in a month) says the format fits. |
Before You Copy Anyone's Streaming Strategy
If you take three things from this breakdown, take these.
- Check your niche before you believe anything about streaming. The same format that earns $91 an hour in crafting earns $0.35 in music. Most streaming advice online is someone describing their own niche and calling it YouTube.
- Low video RPM is an argument for streaming, not against it. The niches with the cheapest video views (Kids, Gaming, Entertainment, Gadgets) are exactly where a stream view pays 2–3.4 times more. If your ad rates disappoint you, live content raises the floor.
- The committed channels in your niche are already showing you the ceiling. Education streamers at 37% revenue share, kids’ channels at 96%, music channels running radio through the winter slump. None of them filmed extra content to get there; they turned catalogs into broadcasts.
For how often to stream, how long, when in the year, and what streams do to your regular videos, read the general study.
The Row These Tables Are Missing
Every niche here got measured. Your channel wasn't – its numbers sit unread in your Studio, shaped by catalog depth, audience regions, made-for-kids flags, and upload rhythm. Reading them is what an AIR audit does: specialists have done it for 3,000+ channels, and streaming is one of the ten areas they grade.
You leave with a:
- full report
- a 30-day plan ordered by impact
- an hour live with a senior strategist to walk through both.