



“Post more often” and “post every day” are the most common pieces of advice in YouTube creator communities. And it does sound logical, because more videos mean more views, which means more revenue. Except that’s only half true, and it’s the less important part. We analyzed 282 channels across 13 niches using a within-channel method (comparing the same channels in months when they posted more versus months when they posted less). Here’s what the revenue-per-video data looks like.
What is the Optimal Posting Frequency by Niche?
Don’t get us wrong: more videos do produce more total revenue, but the connection is trivial, like how more lottery tickets produce more chances of winning. What the general advice given never really addresses is whether each additional video earns less than the one before it.
In this study, one of our partners (a music channel) earns $1,527 per video when posting 1-2 times a month. The same channel earns $28 per video at 16+ videos a month. Total revenue falls from $2,903 to $497. A Gaming channel's RPM drops by 73% the moment it crosses 5 videos per month. An Entertainment channel posting 16+ videos a month earns 33% less total revenue than the same channel posting 1–2 videos a month, despite publishing 8 times more content.
Here is the core finding, condensed into a single table. Save this if you're short on time.
|
Niche |
Niche norm (videos/month) |
Best RPM bucket |
Where RPM or rev/video drops |
Consistency (CV) |
|
Crafting and Handmade |
2 (range: 1–4) |
1–2/mo |
Falls at 3–4+ |
0.38 — stable |
|
Music |
5 (range: 3–16) |
5–8/mo |
Falls sharply at 16+ |
0.35 — stable |
|
Entertainment |
7 (range: 3–16) |
1–2/mo |
RPM flat; rev/video collapses at 16+ |
0.42 — moderate |
|
Gaming medium |
10 (range: 4–19) |
9–15/mo |
RPM falls at 16+ |
0.50 — erratic |
|
Gaming small |
3 (range: 2–8) |
3–4/mo |
Sharp cliff at 5+ |
0.59 — most erratic |
|
Kids & Teens large |
9 (range: 5–17) |
16+/mo (volume play) |
Rev/video always highest at 1–2 |
0.56 — erratic |
|
Kids & Teens medium |
8 (range: 2–15) |
9–15/mo |
Revenue falls at 16+ |
0.53 — erratic |
|
Lifestyle small |
8 (range: 4–15) |
3–8/mo |
Halves above 8/mo |
0.47 — moderate |
|
Education |
26 medium / 15 small |
No data (no channels post Shorts or shift frequency) |
— |
0.19 — most consistent |
|
Music small |
7 (range: 4–14) |
9–15/mo |
— |
0.40 — stable |
|
Gadgets |
5.5 (range: 2–12) |
1–2/mo |
— |
0.50 — erratic |
One sentence that summarizes the table: In every niche except large Kids & Teens channels, the revenue you earn per video decreases as posting frequency increases, and in most niches, RPM follows the same downward direction above a certain threshold.
RPM vs Total Revenue: Which One Tells More?
The main issue with measuring your content against total revenue is that total revenue is relatively easy to grow. Publish 30 videos a month instead of 5, and you’ll almost certainly earn more in total. RPM (revenue per 1,000 views), on the other hand, is the efficiency metric. It tells you how well your audience and your content convert impressions into ad revenue. And revenue per video (total channel revenue divided by videos published that month) is even more direct: it tells you how much each additional video earned.
When you post more videos than your audience can absorb, three things happen simultaneously.
- First, each video gets fewer views because the same subscriber base is spread more thinly across more content.
- Second, lower-quality content typically enters the mix, reducing average watch time and audience retention signals that affect CPM.
- Third, the monetized playback rate often falls, and a smaller fraction of views carries an ad, which compresses RPM.
This is the dynamic this research measures, because posting more does earn more money (trivially), but at the same time it doesn’t give you more money per video and doesn’t maintain RPM (mostly; the exceptions are niche-specific).
How We Ran This Study
The data for this research comes from 282 channels across 13 niches with YouTube Analytics API access.
What we measured:
Posting frequency was categorized into five buckets: 1-2 videos per month, 3-4 videos per month, 5-8 videos per month, 9-15 videos per month, and 16+ videos per month. For each bucket, we tracked:
- Median RPM (revenue per 1,000 views, the primary monetization efficiency metric)
- Median revenue per video (total estimated revenue divided by videos published)
- Median total monthly revenue
- Monetized playback rate (share of views that carry an ad)
- CPM (advertiser-side cost per 1,000 impressions)
The standard approach to comparing these metrics is to look at channels that post a lot against channels that post rarely, which has an obvious problem: those are different channels. Pretty obvious conclusion, but why is comparing different channels a problem in the first place? A channel posting 20 videos a month might have a larger team, better production quality, and more ad-friendly content than one posting 2 videos a month. Any RPM difference you find might reflect those core differences.
The within-channel design avoids this by including only channels that appeared in at least two different frequency buckets across months. We're comparing each channel to itself across its high-posting months and low-posting months. This removes the channel-level confound and leaves posting volume as the primary differentiator.
The confounder that remains: channels may post more in months when they're generally more active. If those months also have better RPM, the correlation could reflect activity level rather than frequency itself. This is a genuine limitation that cannot be fully eliminated.
One additional context note that affects how to read any monthly RPM figure in this dataset: Q4 (October–December) is structurally different from the rest of the year. Advertiser spending peaks in Q4 as brands exhaust annual budgets before year-end: CPM in December can run 40–60% higher than in January or February.
Channels that happened to post more videos in Q4 may show higher RPM in those frequency buckets because of seasonal advertiser demand. The within-channel design partially controls for this (the same channel appears in multiple buckets across different months), but it does not fully eliminate the seasonal confound. Where possible, interpret RPM figures as annual medians rather than fixed benchmarks, and be cautious about comparing your own Studio data against these figures if you're looking at a single quarter.
The month-by-month median RPM is in our 2026 YouTube RPM statistics.
Why are other channels outgrowing you?
It's not luck. There's a specific reason — and our specialists who've audited 3,000+ channels will find it in yours.
Show me what to fixHow Does Posting Frequency Affect Your RPM?
Across the niches in the research pool, RPM follows a consistent pattern: it is highest at low posting frequencies and falls as posting volume increases.
The revenue-per-video collapse is the most striking finding. Even when total monthly revenue increases with more videos, the per-video figure falls dramatically:
|
Niche / Tier |
Rev/video at 1–2/mo |
Rev/video at 16+/mo |
Ratio |
|
Music medium |
$1,527 |
$28 |
55× |
|
Kids & Teens medium |
$1,040 |
$11 |
95× |
|
Entertainment medium |
$2,971 |
$155 |
19× |
|
Gaming medium |
$565 |
$30 |
19× |
|
Kids & Teens large |
$2,161 |
$165 |
13× |
A Music channel earning $1,527 per video when it posts 1-2 times a month earns $28 per video at 16+ videos per month. The same channel. The same niche. A 55× collapse in per-video revenue. This is the clearest possible illustration of what "more videos = more revenue" means in practice: each additional video earns a tiny fraction of what fewer videos would have earned.
The mechanism is view dilution. When a channel posts 16 videos in a month, each video competes with the others for the same subscriber base's attention and for the same algorithmic distribution budget. Total views may grow, but they grow much more slowly than video count, so per-video views and per-video revenue collapse.
The findings do not mean posting 16+ videos per month is always wrong.
Your channel is unique, so the answer will always depend on your goals. If you feel like your channel should be earning more than it is, something in your mechanics can be capping the potential revenue, and it’s rarely obvious from inside your own Studio at a glance. We've diagnosed this across 3,000+ channels and will tell you exactly what to fix first. → Find what's holding you back
Does Revenue Per Video Drop as You Post More?
The revenue-per-video metric answers the practical question most creators ask: "Is it worth making this extra video?" If the answer is that posting one more video earns $28 instead of $1,527, the time cost of that video needs to be weighed against $28 in marginal revenue.
The total monthly revenue picture is more complicated:
|
Niche |
Peak total revenue |
At what bucket |
16+ bucket revenue |
|
Entertainment medium |
$5,791 |
1-2/mo |
$3,850 |
|
Music medium |
$2,903 |
3-4/mo |
$497 |
|
Kids & Teens large |
$7,575 |
16+/mo |
- (peak) |
|
Kids & Teens medium |
$1,472 |
9-15/mo |
$596 |
|
Gaming medium |
$1,425 |
9-15/mo |
$1,210 |
|
Lifestyle small |
$416 |
5-8/mo |
$277 |
Entertainment medium channels posting 1-2 videos per month earn $5,791, which is 50% more than the same channels posting 16+ ($3,850). This is the cross-frequency comparison most creators don't run because they're focused on absolute video count rather than revenue per unit of effort.
Music medium is the most extreme: $2,903 at 3-4 videos per month versus $497 at 16+, which is a 5.8× total revenue gap between the optimal frequency and the high-frequency bucket. A Music channel that decides to "post more" and doubles its monthly output from 4 to 16 videos could be cutting its total monthly revenue by 83%.
The only niche where total revenue unambiguously scales with posting volume is Kids & Teens large (10M–50M monthly views), where 16+ videos per month produce $7,575, the highest total revenue in the dataset. This case is discussed in detail in the Kids & Teens section.
How Consistently Do Channels Post in Each Niche?
Before interpreting frequency recommendations, it's essential to understand what "normal" looks like in each niche. What seems like high-frequency posting in one niche may be below average in another.
|
Niche |
Median videos/month |
Normal zone (p25–p75) |
Consistency (CV) |
Stability |
|
Education medium |
26 |
13–31 |
0.187 |
Most consistent |
|
Education small |
15 |
5–25 |
0.283 |
Very consistent |
|
Music medium |
5 |
3–16 |
0.347 |
Stable |
|
Crafting medium |
2 |
1–4 |
0.382 |
Stable |
|
Lifestyle medium |
9 |
6–27 |
0.389 |
Moderate |
|
Music small |
7 |
4–14 |
0.400 |
Moderate |
|
Entertainment medium |
7 |
3–16 |
0.419 |
Moderate |
|
Lifestyle small |
8 |
4–15 |
0.471 |
Moderate |
|
Gaming medium |
10 |
4–19 |
0.497 |
Erratic |
|
Gadgets medium |
5.5 |
2–12 |
0.504 |
Erratic |
|
Entertainment small |
2 |
1–20 |
0.509 |
Erratic |
|
Kids & Teens medium |
8 |
2–15 |
0.529 |
Erratic |
|
Kids & Teens large |
9 |
5–17 |
0.555 |
Erratic |
|
Gaming small |
3 |
2–8 |
0.592 |
Most erratic |
The consistency metric (coefficient of variation = standard deviation ÷ mean of monthly video count) measures how regularly channels post, normalized for volume. A CV of 0.19 means output varies by about 19% around the average. A CV of 0.59 means output swings by 59% month to month.
The niche context makes frequency recommendations interpretable. Posting 16 videos per month in Music is an anomaly; the median Music channel posts 5. Posting 16 videos per month in Education is near the median. Without this context, the frequency bucket data cannot be correctly read.
Education is the most consistent niche by a wide margin. Education medium posts 26 videos per month at CV 0.187, a schedule-driven content model where consistency is built into the format (course content, regular explainers).
Gaming small is the most erratic niche in the dataset (CV 0.592). Gaming small channels both post at harmful frequencies and do so inconsistently. This double penalty is documented in the data: Gaming small shows a sharp RPM cliff at 5+ videos per month AND the highest month-to-month variability of any niche. The worst of both dimensions.
Kids & Teens consistency worsens with scale, the opposite of every other niche. Large Kids channels (CV 0.555) are more erratic than medium (0.529) and small (0.454). This reflects compilation and seasonal strategies: large Kids channels burst-post compilation packages followed by lower-output months.
What is the Optimal Posting Frequency by Niche?
Click yours to go straight to the numbers.
What is the Cliff for Gaming Channels?
Gaming medium channels follow a non-monotonic pattern across frequency buckets, where RPM drops from 3-4 videos per month, recovers at 9-15, then falls at 16+. The most practically important finding is at the small tier.
Gaming small channels show the sharpest RPM cliff in the entire dataset. RPM at 3-4 videos per month ($2.33) plummets to $0.63 at 5-8 videos per month, which is a 73% drop. At 9-15 videos per month, it partially recovers to $0.87, but never returns to the 3-4 bucket level.
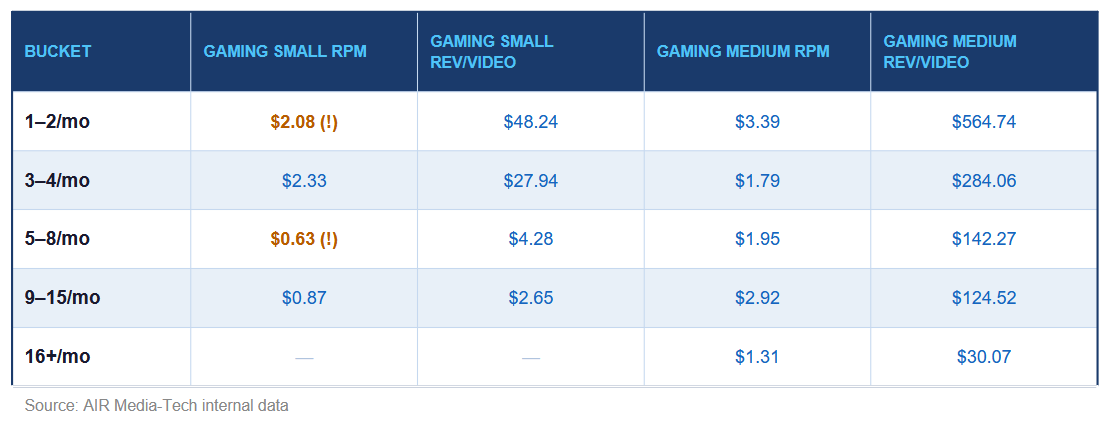
The norm for Gaming small is 3 videos per month. The data suggest that the revenue sweet spot sits at the lower end of that normal range, 3-4 videos per month, where RPM is highest and per-video revenue is meaningful. Moving above 5 videos per month produces the most dramatic RPM collapse in the study.
Which is to say, the gaming medium is nuanced. The 9-15 bucket produces the highest total monthly revenue ($1,425) and a reasonable RPM ($2.92). The 16+ bucket shows RPM falling to $1.31 and per-video revenue collapsing to $30 from $565 at 1–2/month. For the gaming medium, 9-15 videos per month appear to be the ceiling where both total revenue and RPM are still acceptable.
Gaming is also the most erratic niche at both tiers (CV 0.497–0.592). The combination of high variability and the 5+ cliff suggests that Gaming channels' worst revenue months may correlate with the months they over-post, which is a pattern worth examining in your own Studio data.
How Often Can You Post in the Music Niche?
Music is one of the clearest niche-frequency stories in the dataset. Medium Music channels show a consistent RPM rise from 1-2 videos per month ($2.07) through 5-8 per month ($2.85), then a gradual decline through 9-15 ($2.69) and a sharper fall at 16+ ($1.60).
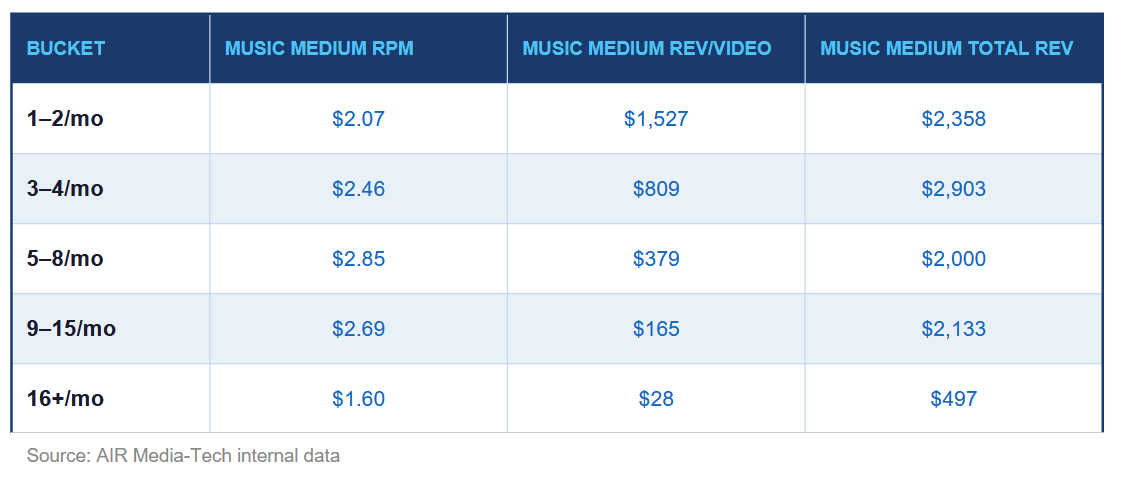
The RPM peak is at 5-8 videos per month, but the total revenue peak is at 3-4 per month ($2,903 vs $2,000 at 5-8). This creates a strategic choice between RPM efficiency (5-8/month) and total revenue (3-4/month). Given that Music is the niche where Content ID revenue supplements ad revenue, and that Content ID payouts are independent of posting frequency, the total revenue signal matters more here than in other niches, and it points to 3-4 videos per month as the optimal zone.
The 16+ collapse is dramatic: $2,903 at 3-4/month versus $497 at 16+. A Music channel posting 16 times a month earns 83% less total revenue than the same channel posting 3-4 times. The niche median is 5 videos per month (normal zone: 3-16). Most Music channels are posting near or below their revenue optimum; the damage comes when channels try to accelerate above that level. Small Music channels appear to benefit from higher relative posting, possibly because they're still in audience-building mode where frequency drives discovery more than it dilutes views.
Does Posting More Help or Hurt the Entertainment Niche?
Entertainment is the anomaly in the RPM data. Across all five frequency buckets for the Entertainment medium, RPM barely moves: $3.47 (1-2), $4.41 (3-4), $3.55 (5-8), $3.97 (9-15), $4.34 (16+). This is the only niche where RPM shows no clear frequency-related decline.
But the per-video revenue and total revenue data tell a completely different story:
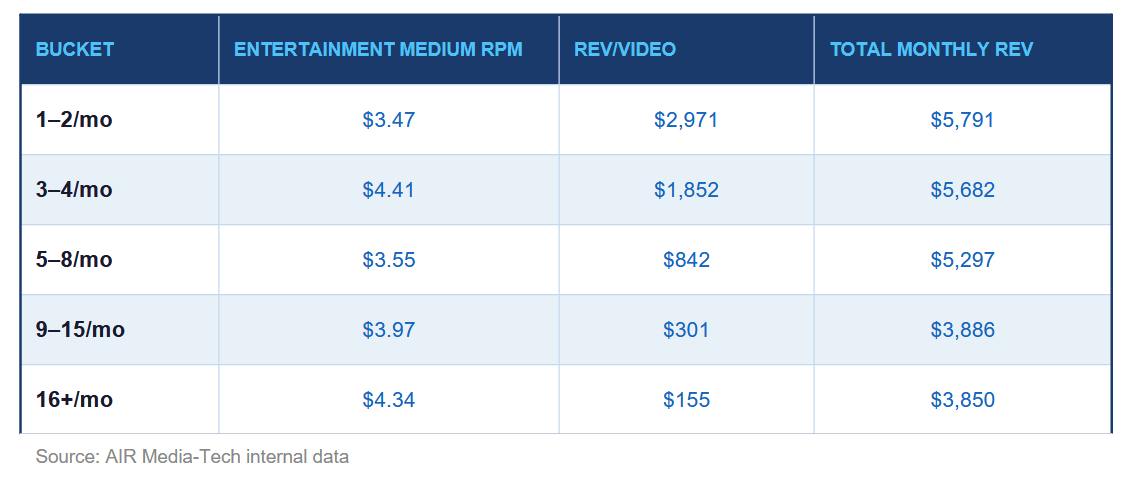
Entertainment channels posting 1-2 videos per month earn $5,791 in total monthly revenue and $2,971 per video. Entertainment channels posting 16+ per month earn $3,850 total and $155 per video. RPM is nearly identical, but total revenue is 33% lower, and per-video revenue has collapsed 19×.
The explanation: Entertainment channels have large, loyal audiences whose viewing behavior is relatively independent of posting frequency. The same impression pool watches the same channel regardless of whether it posts 2 or 20 videos. When frequency increases, each video gets a smaller share of a roughly fixed attention budget, so per-video views fall, per-video revenue falls, and total revenue declines despite publishing more content.
The niche norm is 7 videos per month (range 3-16). The revenue data clearly support operating at the low end of that range. Entertainment channels posting 3-4 videos per month earn nearly the same total revenue as those posting 1-2, but at a meaningfully higher RPM; hence, the 3–4 bucket is the optimal zone for Entertainment.
Is It Safe to Post More Videos for the Kids & Teens Niche?
Kids & Teens is the clearest exception in the dataset. At the large tier (10M–50M views), posting 16+ videos per month produces the highest total monthly revenue ($7,575) and the most views (22.2M median). At the medium tier, 9-15 videos per month is the revenue peak ($1,472).
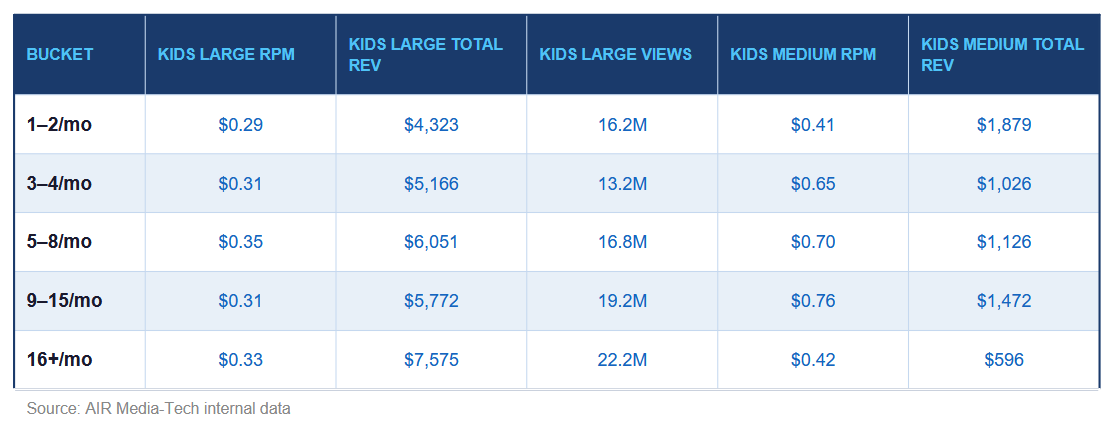
At the large tier, RPM is structurally stable across all buckets ($0.29–$0.35), which is the COPPA effect. YouTube severely restricts ad serving on kids' content, so RPM is compressed regardless of posting volume. At these RPM levels, total revenue is almost entirely determined by total view volume. Large Kids channels operating at scale have subscriber bases large enough to distribute views across many videos simultaneously, so, in this case, more videos mean more total views, and more total views mean more total revenue, even at flat RPM.
At the medium tier, the pattern is different. RPM rises meaningfully from 1-2 ($0.41) through 9-15 ($0.76) before falling sharply at 16+ ($0.42). The 9-15 bucket is both the RPM peak and the total revenue peak ($1,472 vs $596 at 16+). Medium Kids channels lose both RPM efficiency and total revenue above 9-15 videos per month.
A critical caveat applies to both tiers: per-video revenue is always highest at 1-2 videos per month ($2,161 at large, $1,040 at medium). At 16+ videos per month, per-video revenue falls to $165 (large) and $11 (medium). This is where the question of "is posting this video worth it?" becomes most acute for Kids channels.
What Works Best for Lifestyle Channels?
Lifestyle small channels show one of the cleanest frequency-RPM curves in the dataset. RPM rises sharply from 1-2 videos per month ($4.69) to 3-4 ($9.06) and 5-8 ($9.01), then cuts in half at 9-15 ($4.83) before stabilizing at 16+ ($5.15).
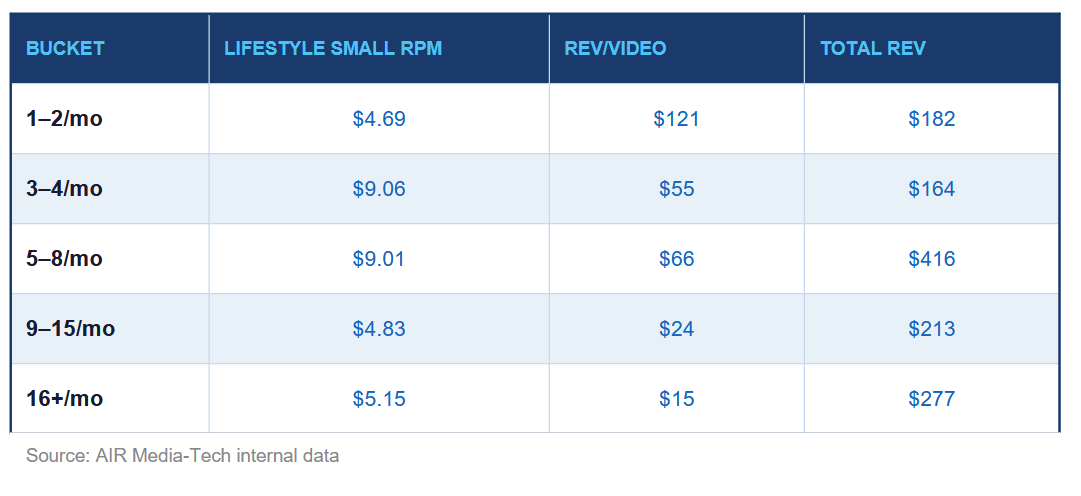
The 5-8 bucket produces both the highest RPM and the highest total revenue ($416). The halving of RPM at 9+ per month is the clearest threshold in the Lifestyle small data. The niche norm is 8 videos per month (range: 4-15); channels posting at the upper end of the normal zone (8-15) are already in the RPM compression range.
Crafting and Handmade: What Works Best?
Crafting medium channels presents a relatively simple picture. With a niche norm of just 2 videos per month and only two frequency buckets with sufficient data:
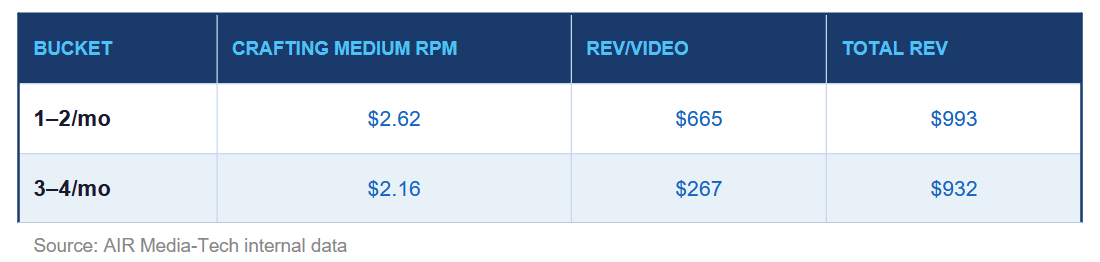
RPM and per-video revenue are both higher at 1–2 per month. Total monthly revenue barely changes ($993 vs $932); posting twice as many videos produces nearly the same total revenue at lower per-video efficiency. The niche normal zone is 1–4 videos per month, meaning most Crafting channels already operate within or near their revenue optimum.
Crafting has the lowest posting variability among non-low-confidence niches at medium scale (CV 0.382); these channels maintain stable, predictable posting cadences. This consistency pattern aligns with the nature of the content: project-based videos that take time to produce and don't benefit from high-frequency output.
What Does the Data from Education & Science Show Us?
Education has the highest RPM in the dataset ($15.64 at small tier, $13.02 at medium), and it has the most consistent posting schedule (CV 0.187 at medium, 0.283 at small). But Education channels do not appear in the within-channel frequency data because they do not vary their posting volume enough to generate multiple frequency buckets in the same channel over time.
This absence is informative. Education channels posting 13-31 videos per month do so consistently, month after month, without the frequency swings that would generate within-channel variation. The content model is schedule-driven, and the cadence is maintained because the content type demands it.
What the niche norm data does show: Education medium channels post 26 videos per month at $13.02 RPM. This is the highest RPM at the highest posting volume in the dataset, which might seem to contradict the general pattern. It does not, because this is not a within-channel finding. Different niches have different CPM profiles based on advertiser demand. Education commands premium CPMs because educational advertisers (SaaS tools, online learning platforms, financial products) pay more to reach actively learning, high-intent audiences. A Gaming channel posting 26 videos per month would not get $13 RPM; an Education channel posting 5 videos per month would not get Gaming's RPM. The RPM is niche-determined.
Increasing or Decreasing the Posting Frequency? What Does the Evidence Say?
A Ukrainian legal advice channel specializing in pension law came to AIR posting at an extremely high volume, 386 videos in three months, averaging well above 16+ videos per month. Revenue was $743. AVD was 2:19. Subscribers were growing slowly.
We have advised cutting publishing volume by 57% (165 videos in the next period) and focused entirely on structural quality: title and metadata optimization, retention engineering through script restructuring, Shorts monetization activation, and Gyre streams.
Results November 2025 – January 2026 vs the prior period:
- Publications: 386 → 165 (−57%)
- Views: +11.3%
- Watch time: +175%
- Revenue: +141%
- Subscribers: +224%
- Average view duration: 2:19 → 4:25 (+91%)
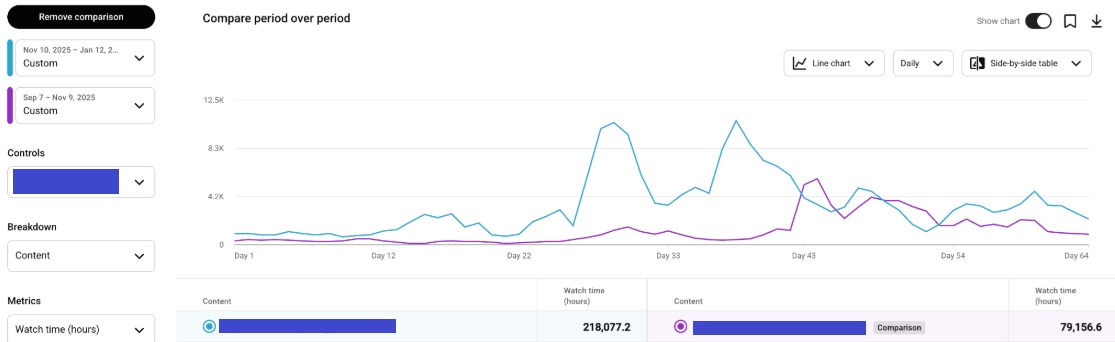
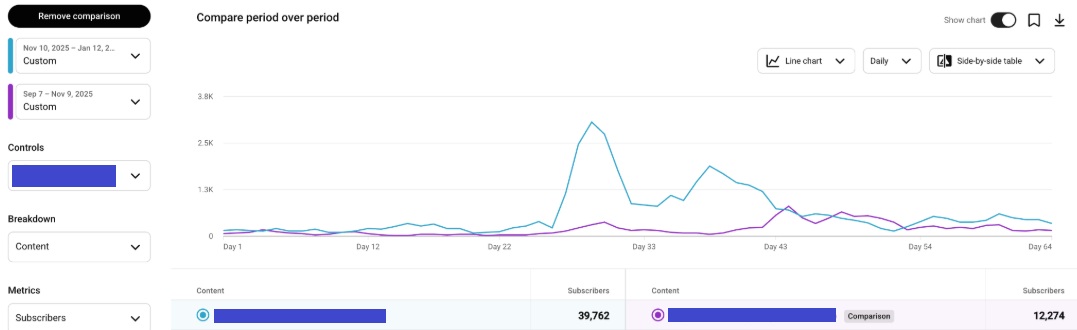
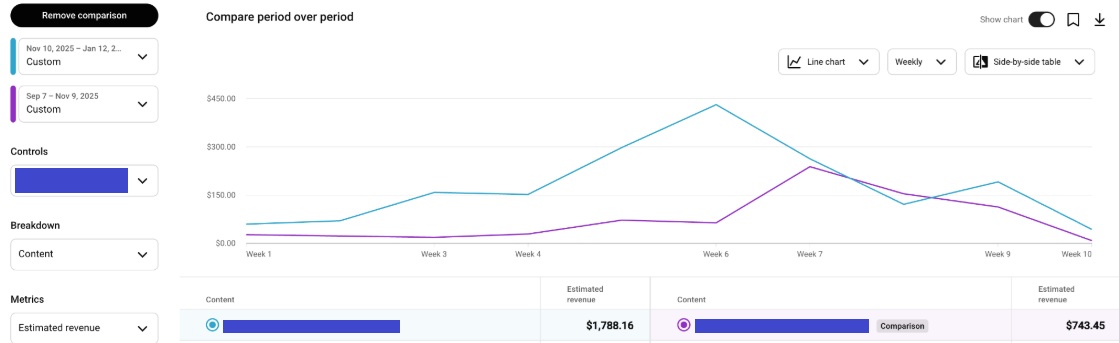
Revenue grew 12× faster than views. Impressions grew 164% despite fewer uploads. Every metric improved while the channel published half as many videos. The legal channel niche sits in the Business/Education CPM range, where the per-video revenue collapse at high frequency is most costly.
A multilingual kids' educational network (DONA, 8 language channels) received two recommendations applied simultaneously across all channels: increase upload frequency and launch Shorts. The channels had been underpublishing relative to the Kids & Teens niche norm. Results from the moment of implementation:
|
Channel |
Views |
Revenue |
|
Korean |
+30.6% |
+37% |
|
Hindi |
+59.6% |
+37.5% |
|
Vietnamese |
+69.9% |
+78.8% |
|
Portuguese |
+18.9% |
+43.2% |
|
Chinese |
+18.3% |
+55.5% |
|
Spanish |
+7.2% |
+11.8% |
|
Thai |
+6.7% |
+6.1% |
|
English |
+5.2% |
+3.4% |
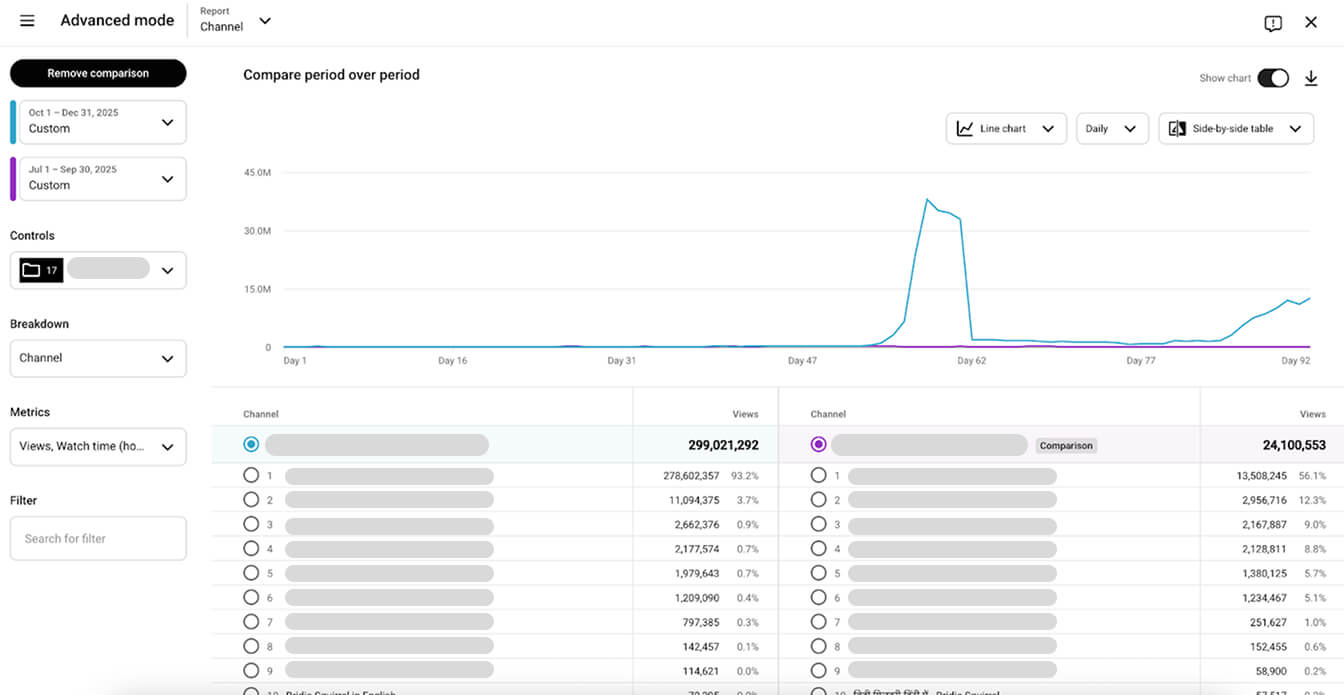
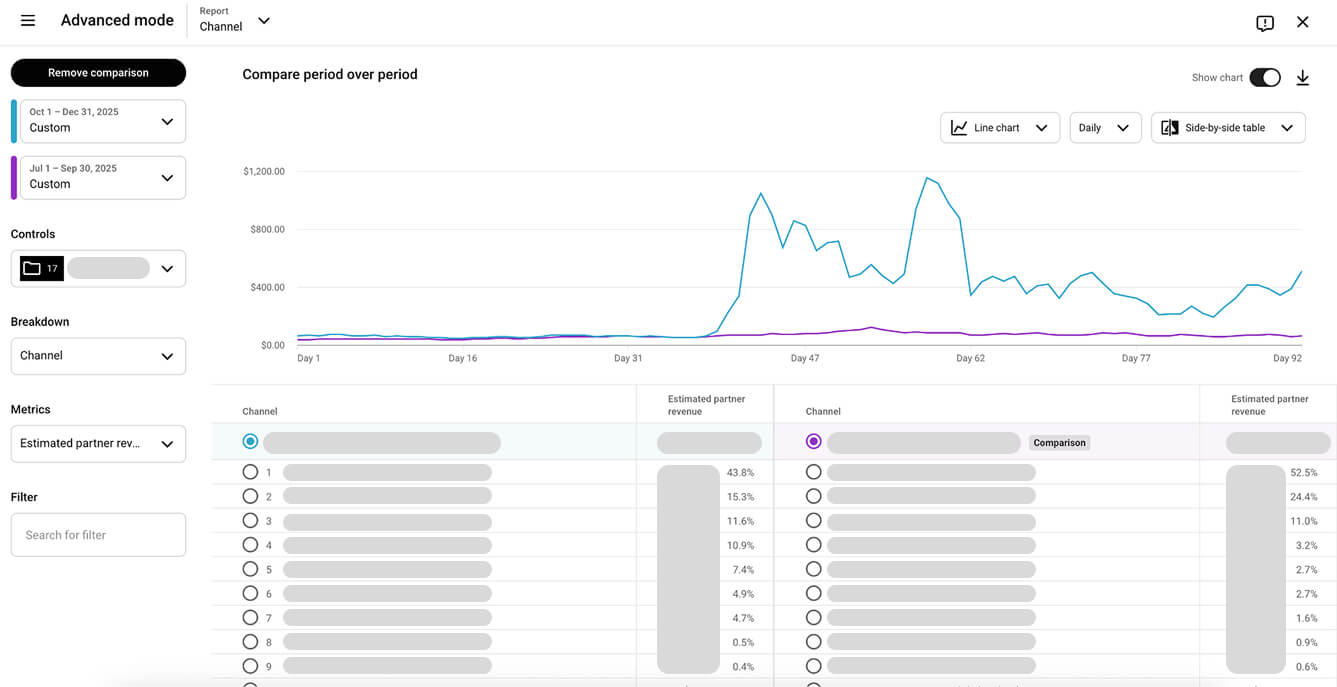
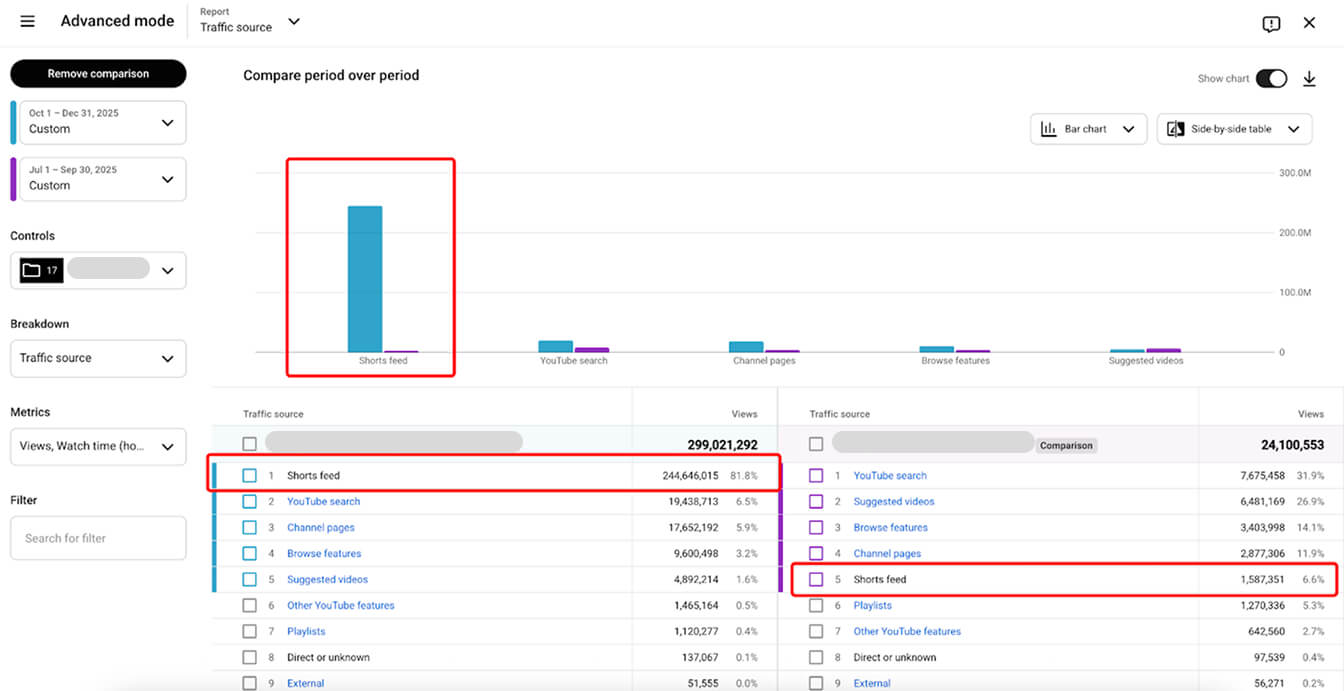
Every channel grew, no exceptions. Revenue grew faster than views in six of eight markets, most dramatically in Portuguese (+43.2% revenue on +18.9% views) and Chinese (+55.5% on +18.3%). The English channel showed the smallest gains, consistent with a market that was already better monetized at its starting frequency. This case illustrates the other side of the frequency curve: channels posting below the niche norm for Kids & Teens medium (8/month) benefit from moving toward it, because they were leaving algorithmic distribution signal on the table.
The Small Channel case is the exception worth naming: a Canadian entertainment channel did increase posting volume as part of a multi-lever intervention, but the frequency increase was paired with a full audit, copyright cleanup, Shorts strategy, and thumbnail rebuilds. Publishing volume grew +111%, views grew +268%, watch time grew +624%, and revenue grew +55% month-over-month. This is not a case that argues for posting more; it's a case that argues for posting more while fixing everything else simultaneously.
Quality Vs Quantity: What The Data Says
The quality-versus-quantity debate has been running in the creator community for years, and both sides produce anecdotal evidence. The data here gives a more specific answer.
|
Niche |
Does more frequency help RPM? |
Recommended zone |
Why |
|
Crafting medium |
No |
1–2/mo |
Already near optimal; extra videos dilute per-video revenue with no total rev gain |
|
Music medium |
Up to a point |
3–5/mo |
RPM peaks at 5–8 but total rev peaks at 3–4; above 8 costs both |
|
Entertainment medium |
RPM neutral; total rev hurt |
1–3/mo |
Per-video revenue collapses at 16+; total rev 33% lower at high frequency |
|
Gaming medium |
Non-monotonic |
9–15/mo |
Complex pattern; highest total rev at 9–15 with acceptable RPM |
|
Gaming small |
No — cliff at 5+ |
3–4/mo |
73% RPM drop above 4/month; stay below the cliff |
|
Kids large |
Yes — total rev scales |
16+/mo |
Only exception: COPPA-flattened RPM means total revenue is view-volume dependent |
|
Kids medium |
Up to 9–15 |
9–15/mo |
RPM peaks there; both RPM and total rev fall at 16+ |
|
Lifestyle small |
Up to 8 |
5–8/mo |
Clear halving of RPM above 8/month |
|
Education |
Consistent high volume is the niche norm |
13–31/mo |
Not a frequency question; niche demands schedule-driven content at high volume |
The data supports a conclusion that is more nuanced than "quality beats quantity." The correct answer depends on your niche, your tier, and what you're optimizing for.
For most niches, the pattern is: there is a posting frequency above which RPM or per-video revenue begins to fall, and that threshold is lower than most creators assume. For Gaming small, it's 5 videos per month. For Lifestyle small, it's 8. For the music medium, it's 8. For the entertainment medium, per-video revenue is highest at 1–2 per month and never recovers.
For Kids & Teens large, the pattern inverts: total revenue scales with volume because RPM is already at its COPPA floor and the channel's view distribution capacity is large enough to sustain many videos simultaneously. This is the one niche where "post more" is a defensible total revenue strategy.
For the Gaming medium and the Kids medium, there is a genuine optimal zone (9–15/month for both) above which revenue falls. Channels operating in these niches should identify their optimal zone and resist pressure to push above it.
The data supports a clear strategic framework: find the niche-specific frequency threshold where RPM and per-video revenue are still healthy, and stay there. For most niches, that threshold is lower than the advice to "post more often" suggests. The exception is Kids & Teens large, and it is an exception specifically because COPPA has already compressed RPM to a floor where the only remaining lever is view volume.
Key Takeaways For Creators
- Revenue per video is a more honest number than total revenue.
Total revenue can grow with more videos while per-video revenue collapses. A Music channel earning $2,903 total at 3-4 videos per month and $497 at 16+ is producing 5.8× less total revenue while doing 4× more work. Before increasing posting frequency, calculate your current revenue per video and compare it to what the niche data shows at higher buckets.
- Every niche has a frequency threshold above which revenue falls.
For Gaming small, it's 5 videos per month. For Lifestyle small, it's above 8. For the music medium, it's above 8. For the entertainment medium, per-video revenue is highest at 1–2 per month. These thresholds are not obvious from inside your own Studio data, but they are measurable if you compare your own high-frequency months against your low-frequency months.
- The Kids & Teens large exception is real but narrow.
At the 10M–50M view scale, in a COPPA-regulated niche where RPM is structurally flat, total revenue scales with view volume. This logic does not apply at the medium or small tier, and it does not apply to any other niche in the dataset.
- Consistency matters as much as frequency.
Gaming small has both the highest posting variability (CV 0.592) and the steepest RPM cliff. Education has the lowest variability (CV 0.187) and the highest RPM. These are not coincidences; erratic posting disrupts the algorithm's ability to understand and route a channel, while consistent schedules build predictable distribution patterns. The goal is not to post the maximum number of videos; it's to post the right number reliably.
What The Data Can't Tell You About Your Specific Channel
The patterns above describe what happens across 282 channels. Your channel is one channel, with its own audience geography, content quality, monetization setup, niche positioning, and production capacity. Whether posting one more video per month will hurt your RPM depends on variables this dataset cannot see:
- Where you currently sit on the frequency-RPM curve
- How much your per-video view count would fall with additional uploads
- And whether your audience can absorb additional content without disengagement.
The only way to answer this precisely is to run the within-channel analysis on your own Studio data, compare your own high-frequency months against your own low-frequency months, and track what happens to RPM, per-video revenue, and monetized playback rate. That analysis will tell you whether you're below your threshold or above it, and by how much.
That is also what an AIR channel audit does, but with 10 performance dimensions, competitive benchmarking against the right channels in your niche, and 21 AI diagnostic tools trained on a 450K-channel dataset. If you want to know whether your posting frequency is working for your revenue or against it, and what to adjust, the audit is where that specific answer comes from.
What you get:
- A structured report across packaging, retention, traffic sources, format mix, revenue structure, and audience behavior.
- A 30-day action plan ranked by impact.
- A 45–60-minute live walkthrough with a senior AIR strategist.