



Livestreams have a reputation as YouTube’s worst-paying format, and creators skip them because “streams pay pennies.” Our data from 404 channels tells a more complicated story: in half the niches we measured, livestream RPM beats long-form RPM, and channels that stream 8+ times a month earn a median 50% of their ad revenue from live content. The catch shows up elsewhere, in what happens to your regular videos and your time. This study covers livestream RPM by niche, subscriber growth per hour streamed, the effect of streams on regular video views, and the streaming frequency where the numbers work best.
Live Streams vs Videos in Numbers
Streams reward commitment and punish dabbling harder than any format we’ve studied.
- Livestream RPM beats long-form RPM in 5 of 10 niche-size segments we measured. Kids & Teens large channels earn 3.1x more per stream view than per video view; Entertainment small channels earn 3.0x more. The old assumption that live always pays less does not survive contact with the data.
- Where streams pay less per view, they can still carry the channel. Education & Science channels earn a lower RPM on streams, yet streams bring in a median 37% of their total ad revenue, the highest share of any niche.
- Streaming frequency is the strongest lever. Channels that stream 8+ times a month draw a median 50.2% of ad revenue from live. At 1 stream a month, the share is 4.4%.
- Regular video views are usually lower in streaming months. In 7 of 8 within-channel comparisons, the same channels saw fewer views per video in months when they streamed. Lifestyle is the exception at +7.2%. Much of this is seasonality and split upload effort, not streams poisoning the channel (we explain the mechanism below).
- Subscriber efficiency peaks at moderate frequency. Gaming channels gain the most subscribers per hour streamed at 2–3 streams a month (0.035 subs/hour). Heavy streamers gain fewer subs per hour but far more in total: 134 median live subs a month at 8+ streams, 27.9% of all new subscribers.
About This Study
We analyzed 404 YouTube channels across 13 niches for the full year 2025 and first quarter of 2026, using real YouTube Analytics data from channels in AIR’s network rather than third-party estimates. The video-performance dataset covers 3,893 channel-months from all 404 channels, streamers and non-streamers alike. The revenue and subscriber dataset covers 1,287 channel-months from the 127 channels that streamed and monetized live content.
We used the channels that streamed irregularly, in some months and not others, and compared each channel to itself. Same channel, same audience, same niche, months with streams vs months without. Channels transitioning into full-time streaming were excluded from this comparison.
How Many Views Does a Typical Livestream Get?
45. That’s the median. In 6 out of 10 streaming months, channels averaged fewer than 100 views per stream.
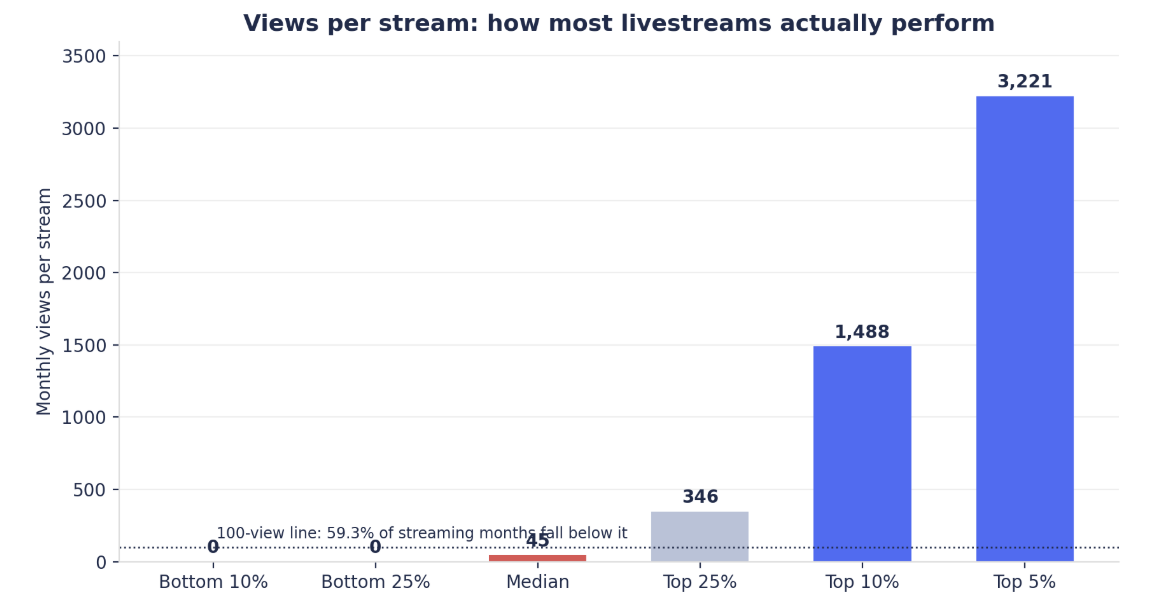
Views per stream across 1,287 streaming months
|
Where you rank |
Views per stream |
|
Bottom quarter |
close to zero |
|
The median |
45 |
|
Top quarter |
~350 |
|
Top 10% |
~1,500 |
|
Top 5% |
~3,200 |
Medians and percentiles across 1,287 streaming months, 2025.
A stream that averages 350 views sits in the top quarter of all monetized streaming on our sample. Fifteen hundred views puts you in the top tenth. Creators who judge their live numbers against the giant concurrent counters they see on YouTube’s biggest streams are comparing themselves to the 99th percentile of a steeply tilted field.
Your niche moves the median a lot. Same measurement, niche by niche:
|
Niche |
Median views per stream |
|
Transport* |
3,814 |
|
Education & Science |
196 |
|
Business & Finance* |
142 |
|
Kids & Teens |
75 |
|
Crafting & DIY* |
71 |
|
Entertainment |
48 |
|
Music |
34 |
|
Food & Cooking* |
30 |
|
Gadgets & Tech* |
21 |
|
Lifestyle |
19 |
|
Gaming |
8 |
Medians across streaming months, 2025. Asterisks mark niches with fewer than ten streaming channels – strong signals rather than settled numbers.
Between Transport and Gaming lies a gap of almost 500x, so “how many views will my stream get” has no platform-wide answer, only a niche answer. But whatever your niche’s number is, don’t judge it yet, because views are the most misread number in streaming.
A stream view and a video view are not the same size. Someone who clicks your 10-minute video might watch four minutes. Someone who joins a stream often stays for 30, 60, or 120 minutes. One channel we work with keeps viewers on its streams for 38 minutes on average, against 8 minutes on its regular videos.
We measured that size difference across the whole sample. On the median monetized channel, one stream generates about 73% of the watch time of one regular upload – from a fraction of the views. In some niches a single stream is worth several videos of watch time: a Transport channel’s typical stream carries as much watch time as five uploads, an Education channel’s slightly more than one upload. At the other end, a Gaming or Gadgets stream delivers a small slice of an upload’s watch time, which is worth knowing before you copy a strategy from another niche.
So 45 stream views can produce more watch time than a thousand video views, and watch time is what YouTube’s ad system pays for. That’s why the small-views number and the big-revenue number don’t contradict each other: streams look tiny on the view counter and heavy on the money line.
How Much of Your Revenue Can Streams Realistically Carry?
Live content takes up a median 7.7% of a streaming channel’s views, but 10.9% of its ad revenue. Every live view punches above its weight. And the harder you lean on the format, the bigger that revenue slice gets.
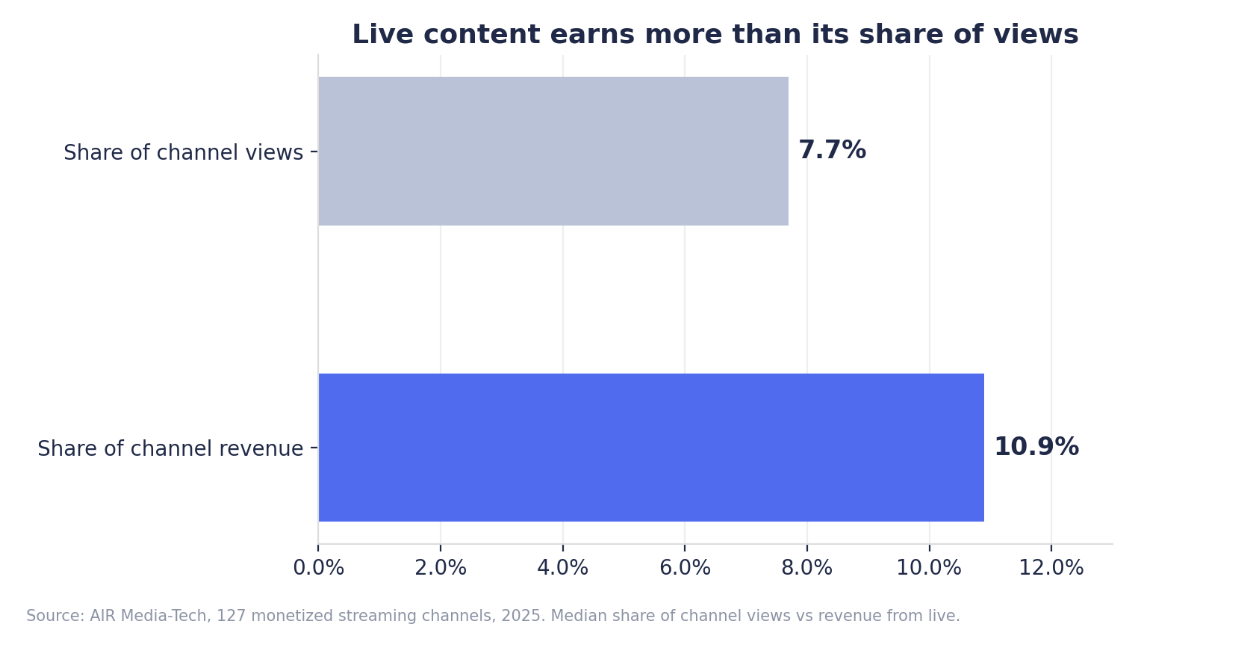
Live share of views vs live share of revenue
We split all 1,287 streaming months into four groups by how often the channel went live:
|
Streams per month |
Live share of ad revenue |
Live revenue per month |
Live subscribers per month |
Live RPM |
Video RPM (same channels) |
|
1 |
4.4% |
$6.11 |
3 |
$2.68 |
$2.22 |
|
2–3 |
16.5% |
$21.62 |
14 |
$4.23 |
$2.35 |
|
4–7 |
28.8% |
$48.56 |
34 |
$3.12 |
$2.17 |
|
8+ |
50.2% |
$337.31 |
106 |
$5.67 |
$4.59 |
All medians. Every row up the table means more revenue, more subscribers, and a bigger share of the channel’s income.
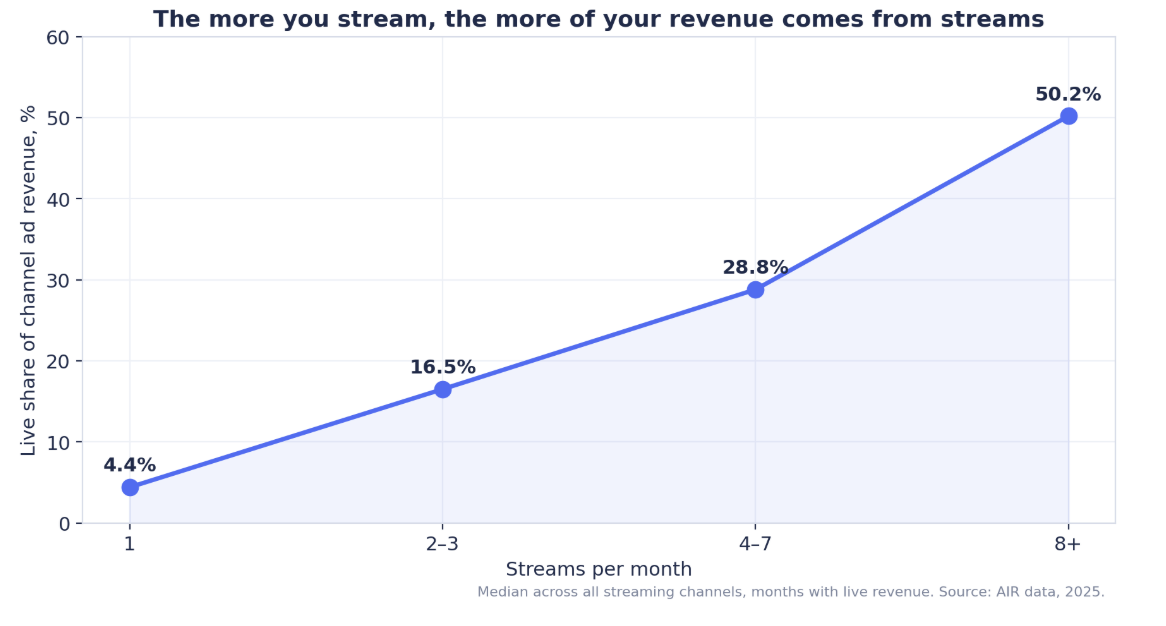
Live share of ad revenue by streaming frequency
There is no tier where streaming more makes things worse. Revenue share climbs from 4.4% to 50.2%. Monthly live income climbs from $6 to $337. Even the rate per view climbs: heavy streamers earn $5.67 per 1,000 live views while one-off streamers earn $2.68, most likely because a stream that runs regularly builds a returning audience that advertisers reach.
The common claim is that live views pay worse than video views – yet at every frequency tier, the same channels’ live RPM matches or beats their video RPM. Even the one-stream-a-month group earns slightly more per live view ($2.68) than per video view ($2.22), and at 8+ streams the gap is $5.67 against $4.59. How live RPM compares with long-form and Shorts is in our YouTube monetization report.
One stream a month is a toe in the water, and it pays like one. The format starts working when it becomes a habit.
Would streams pay on your channel?
Depends on your niche, your catalog, and your audience's regions. AIR's specialists have audited 3,000+ channels and can tell you what streaming would realistically earn on yours — before you spend a single hour on it. → Get your channel audit.
What Does an Hour of Streaming Pay?
The median channel in our data earned $1.88 in ad revenue for every hour it streamed. A quarter of streaming months earned under $0.13 an hour. The best 10% earned $55 an hour and up.
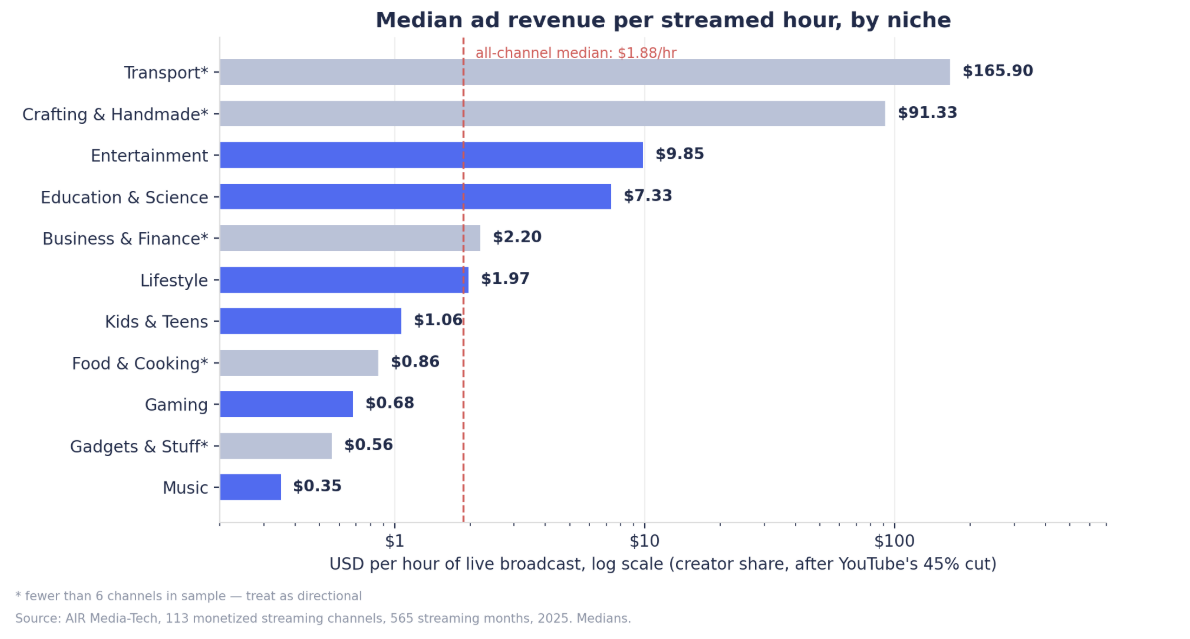
Ad revenue per streamed hour: the full distribution
|
Where you rank |
$ per hour streamed |
|
Bottom quarter |
under $0.13 |
|
The median |
$1.88 |
|
Top quarter |
$10.28 and up |
|
Top 10% |
$55.42 and up |
Ad revenue only. Super Chats, Stickers, and memberships come on top of this – so every number here understates what live earns.
The typical streaming month in our sample ran 50.7 hours of live time and collected about $90 in live ad revenue. And the distribution below that median is harsh – 43.4% of all streaming months paid under $1 per streamed hour.
Read those numbers one way if you stream in person, and the opposite way if you don’t.
If every streamed hour is an hour of your life on camera, $1.88 is a bad wage, and you should stream for the things the hourly rate doesn’t capture: subscribers, community, and the watch-time boost your channel gets. Keep streams short and treat them as events.
But most of the money in this table isn’t earned in person.
The top of the range belongs to channels running 24/7 broadcasts built from videos they have already published: the stream runs around the clock, no camera, nobody in the chair, and every hour is free. The median heavy streamer in our data collects 1.75 million minutes of live watch time a month this way.
Does a Stream View Pay More Than a Video View?
In most niches, yes. We compared live RPM to video RPM on the same channels in the same months, and a stream view out-earned a video view in 8 of the 11 niches we could measure.
For how stream views stack up against long-form and Shorts per million views, see how much YouTube pays for 1 million views.
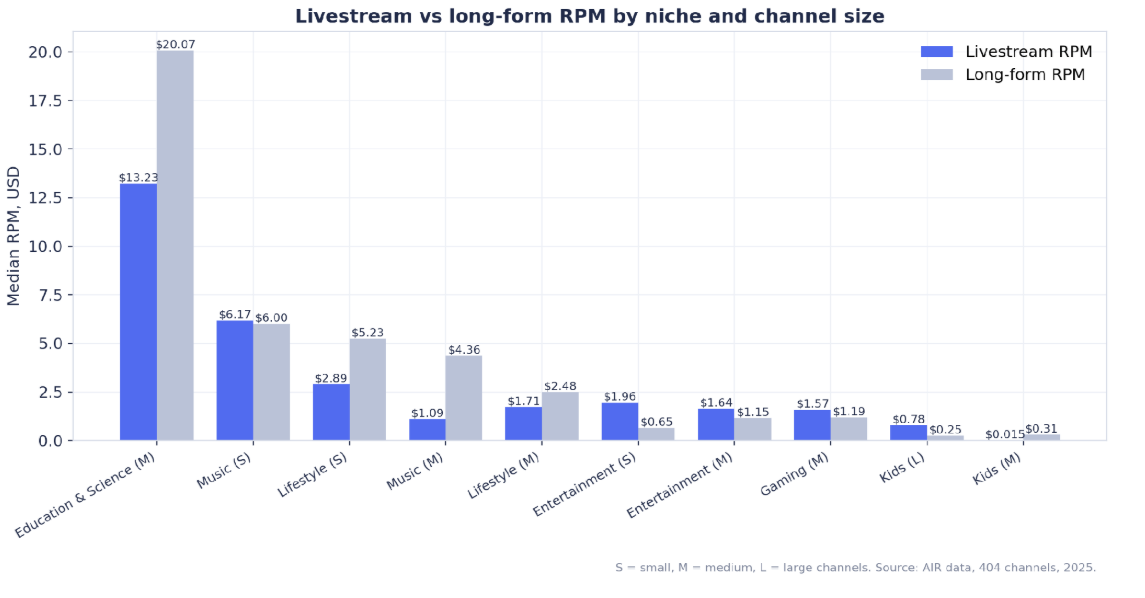
Livestream RPM vs video RPM by niche
|
Niche |
Live RPM |
Video RPM |
Live pays… |
$ per hour streamed |
|
Education & Science |
$17.58 |
$21.48 |
0.8x |
$7.33 |
|
Transport* |
$14.85 |
$5.23 |
2.8x |
$165.90 |
|
Crafting & DIY* |
$9.28 |
$2.61 |
3.6x |
$91.33 |
|
Music |
$6.17 |
$6.00 |
1.0x |
$0.35 |
|
Business & Finance* |
$4.66 |
$5.19 |
0.9x |
$2.20 |
|
Food* |
$4.50 |
$4.17 |
1.1x |
$0.86 |
|
Lifestyle |
$3.80 |
$4.08 |
0.9x |
$1.97 |
|
Entertainment |
$2.70 |
$1.03 |
2.6x |
$9.85 |
|
Gaming |
$2.49 |
$1.15 |
2.2x |
$0.68 |
|
Gadgets & Tech* |
$2.33 |
$0.71 |
3.3x |
$0.56 |
|
Kids & Teens |
$1.45 |
$0.43 |
3.4x |
$1.06 |
All medians, 2025. RPM = revenue per 1,000 views, after YouTube’s cut. Asterisks mark small samples.
The “Live pays” column splits along ad prices. the cheapest video ads on YouTube, and those are exactly the niches where going live multiplies the rate two to three times. Live ad breaks plus much longer viewing sessions pack more paid impressions into every thousand views, and in a cheap niche that extra inventory changes the economics of a view.
In the premium niches (Education, Business, Lifestyle), a stream view lands a little below the video rate. That takes nothing away from the format: Education’s $17.58 per 1,000 live views is the highest live rate in the table, so “a little below premium” still beats every other niche’s streams.
So if your niche sits in the cheap-ads group, streaming is the rare lever that raises your income per view. If it sits in the premium group, streams won’t beat your videos per view, and they don’t need to – they add views your uploads weren’t going to get. We break down each niche separately, so make sure to check it to learn more about yours.
How much can live streaming boost your channel?.
Every row above is a midpoint, with channels on both sides of it, split by audience regions, ad settings, and what they put on stream. AIR's specialists read those variables straight from your Studio data and place your channel against them. → See your streaming potential.
Do Livestreams Bring Subscribers?
Yes – 1.77 new subscribers for every 1,000 live views, compared to 2.44 per 1,000 views on regular videos from the same channels. Live converts a bit worse per view. It wins on something else: volume of attention.
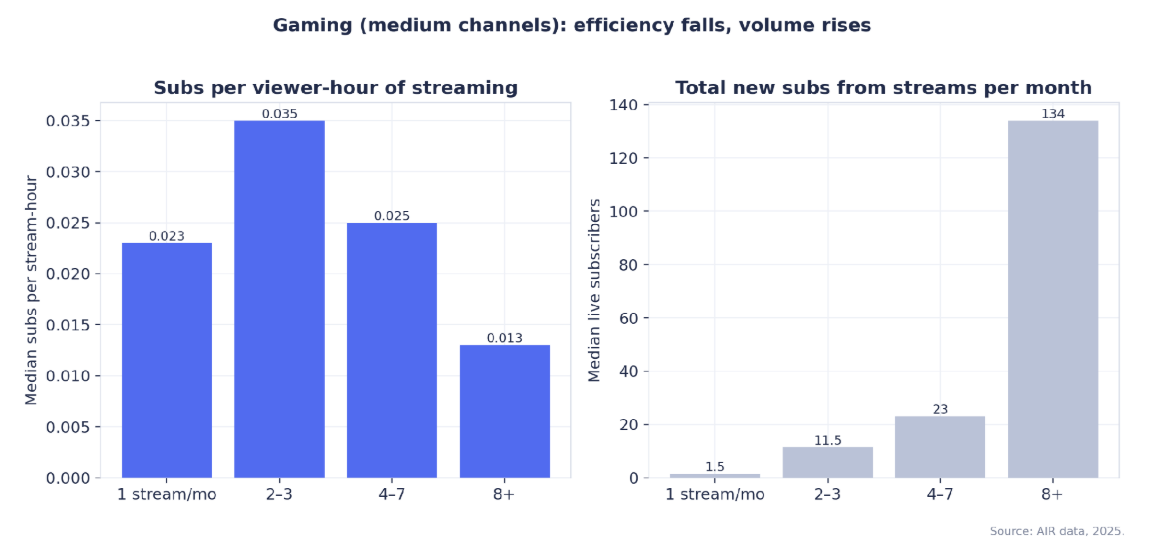
Subs per hour streamed vs total live subs, by frequency
The share of growth that live carries climbs the same staircase as revenue: 2.6% of new subscribers at one stream a month, 7.3% at 2–3 streams, 27% at 4–7, and 40.3% at 8+. Channels streaming 8+ times a month gain a median 106 subscribers from live content. For them, live has stopped being a side format: it recruits four out of every ten new subscribers.
The efficiency pattern is worth knowing before you plan a schedule. Per hour streamed, moderate frequency converts best: at 2–3 streams a month, a stream is still an event, people show up for it, and each hour brings the most new subscribers. At 8+ streams a month, each individual hour converts worse, but there are so many more hours that the totals run far ahead.
The extreme version of this is INRI Motivation, a 478K-subscriber channel that turned its back catalog into permanent streams. Each stream session brings around 1,368 new subscribers, against 81 for a typical upload — 17 times more.
Niche decides both how many subscribers live brings and how well a live viewer converts:
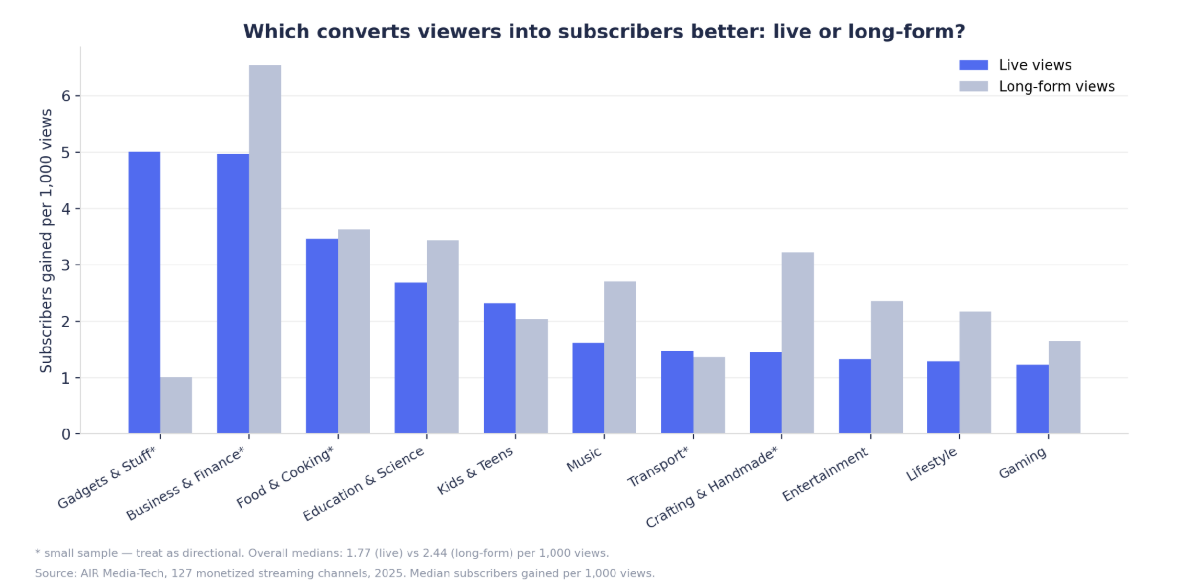
Subscribers per 1,000 views: live vs video, by niche
In three niches, a live view converts better than a video view
|
Niche |
Live subs per month |
Subs per 1,000 live views |
Subs per 1,000 video views |
|
Transport* |
98 |
1.47 |
1.37 |
|
Education & Science |
86 |
2.69 |
3.44 |
|
Kids & Teens |
24 |
2.32 |
2.04 |
|
Music |
12 |
1.62 |
2.71 |
|
Food & Cooking* |
10 |
3.47 |
3.63 |
|
Crafting & DIY* |
3 |
1.45 |
3.22 |
|
Gadgets & Tech* |
2 |
5.01 |
1.01 |
|
Gaming |
2 |
1.23 |
1.65 |
|
Lifestyle |
2 |
1.29 |
2.17 |
|
Business & Finance* |
1.5 |
4.97 |
6.54 |
|
Entertainment |
1 |
1.33 |
2.36 |
Medians across monetized streaming months, 2025. Asterisks mark small samples.
In Kids, Transport, and Gadgets, a live viewer subscribes more readily than a video viewer. The Kids result is the one to remember – it’s the same niche where a stream view also pays 3.4 times more than a video view, so kids’ streams win on both money and growth per view. For raw monthly counts, Transport and Education lead by a wide margin, because their streams draw the biggest audiences in the sample.
Will Streaming Hurt Your Regular Videos?
This is the fear that keeps most creators from going live, so we tested it as strictly as the data allows: we took channels that streamed in some months and not in others, and compared each channel to itself. Same channel and audience – months with streams against months without.
At first glance, the result looks bad. In 7 of 8 groups we could measure, regular videos got fewer views in the months when the channel streamed.
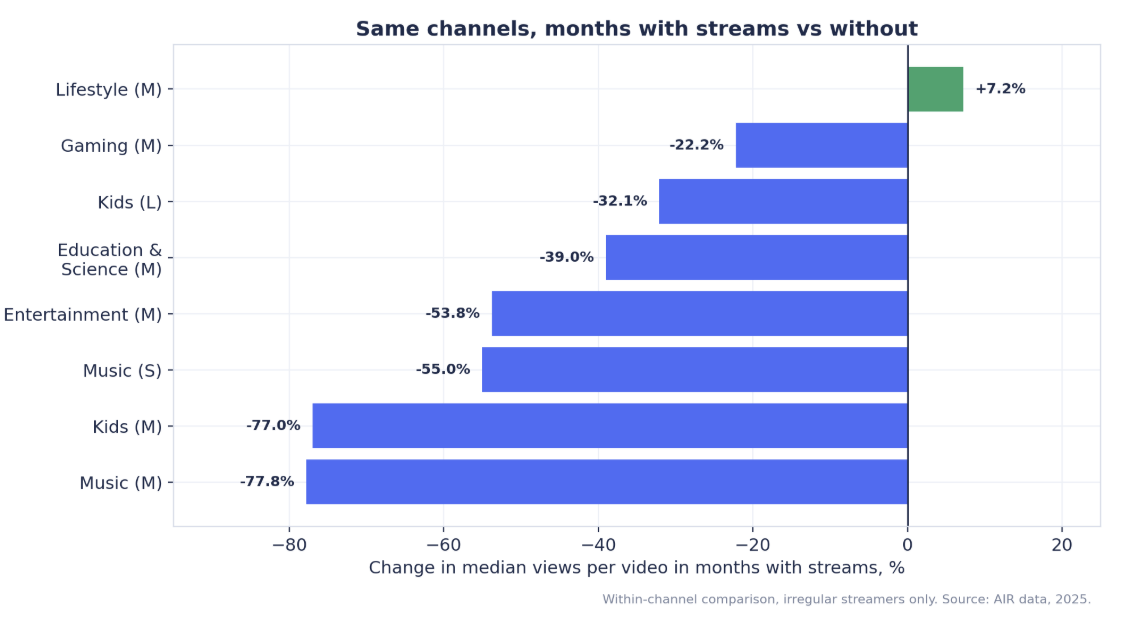
Views per regular video: months with streams vs without
|
Channel group |
Views per video, no-stream months |
Views per video, streaming months |
Change |
|
Lifestyle |
22,432 |
24,052 |
+7.2% |
|
Gaming |
30,867 |
24,009 |
−22.2% |
|
Kids & Teens (large) |
632,743 |
429,375 |
−32.1% |
|
Education & Science† |
— |
— |
−39% |
|
Entertainment |
46,614 |
21,534 |
−53.8% |
|
Music (small) |
3,117 |
1,404 |
−55.0% |
|
Kids & Teens (medium) |
64,194 |
14,781 |
−77.0% |
|
Music (medium) |
79,013 |
17,556 |
−77.8% |
Median views per regular video, same channels compared with themselves.
Then you look at why, and the story changes completely.
- Music channels stream in their slow months. Music was the worst-looking group, with video views down more than half in streaming months. But music channels schedule streams around concerts and seasonal lulls – exactly when their video views are already down. And their total watch time in those “bad” months nearly tripled. The slow month causes the stream. The stream doesn’t cause the slow month.
- Channels that streamed often also uploaded less. Large kids’ channels published a median 31 videos in normal months and only 14 in streaming months. Half the uploads means fewer fresh videos collecting views. And that’s a schedule choice rather than a streaming effect.
- The channels that kept uploading grew. Lifestyle channels streamed about 7 times a month while raising their uploads, and their videos gained 7.2% more views in streaming months. When we lined up gaming channels side by side, the heavy streamers’ regular videos averaged 50,884 views against 36,729 for light streamers – 39% more, not less.
The cleanest real-world test comes from an entertainment channel that works with AIR, that added 24/7 streams and changed nothing else. Six months later its stream revenue had grown from $30.68 to $1,269.41 a month, and its regular videos were also up – 23.6% more views and 28.7% more revenue per video.
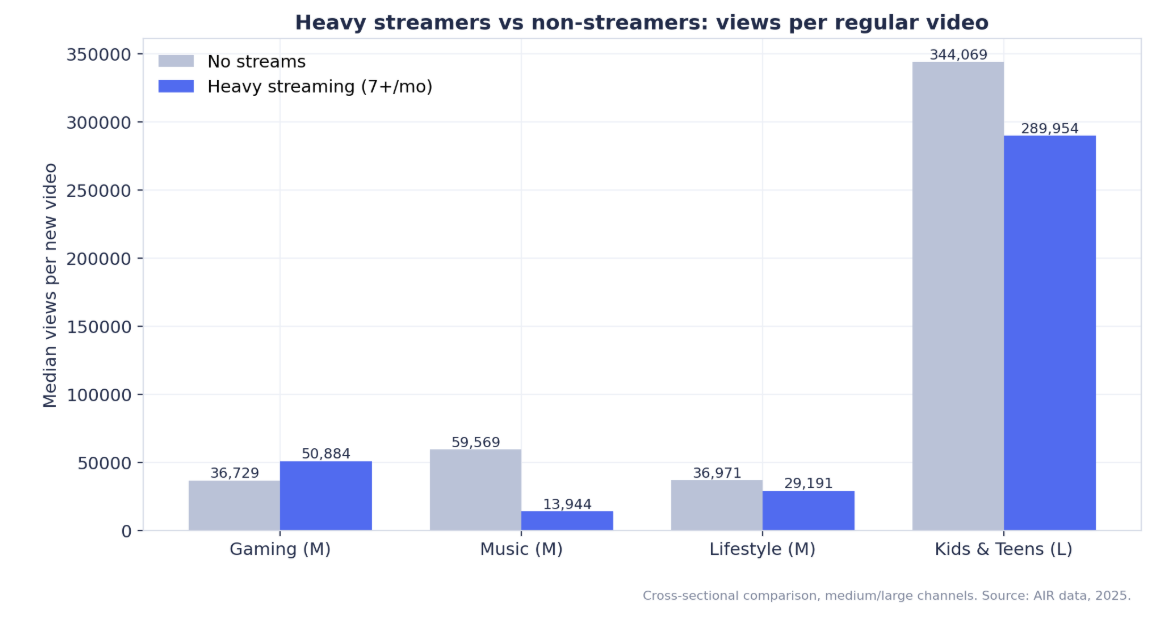
Regular video views: heavy streamers vs light streamers
So the honest answer: keep your upload schedule, and the data gives you no reason to fear streams – and some reason to expect a lift. The only channels whose videos suffered were the ones that streamed instead of uploading, and even they usually traded views for more total watch time. Upload cadence has its own math, which we measured separately across 18,000 channels. TL;DR: consistency beats volume, and streams change neither.
Stream while you sleep
Almost every winning channel in this study runs 24/7 broadcasts built from videos it already published. Gyre allows you to schedule, loop, and optimize streams for you — it was voted streaming Product of the Year 2025. → Start streaming with Gyre.
How Long Should a Stream Be?
Short streams win subscribers. Long streams win money. And all of it depends on the quality of your streaming content. Pick based on what you’re after.
|
Typical stream length |
Subs per hour streamed |
Live RPM |
Live share of ad revenue |
|
Under 1 hour |
0.019 |
$3.95 |
10.2% |
|
1–2 hours |
0.010 |
$5.05 |
15.6% |
|
2–4 hours |
0.006 |
$5.36 |
24.4% |
|
4–8 hours |
0.010 |
$2.44 |
40.7% |
|
8+ hours (round-the-clock) |
0.003 |
$5.08 |
35.1% |
All medians. The 8+ hour group is by far the largest (283 of the 540 months we could classify) because it’s where the 24/7 broadcasts live.
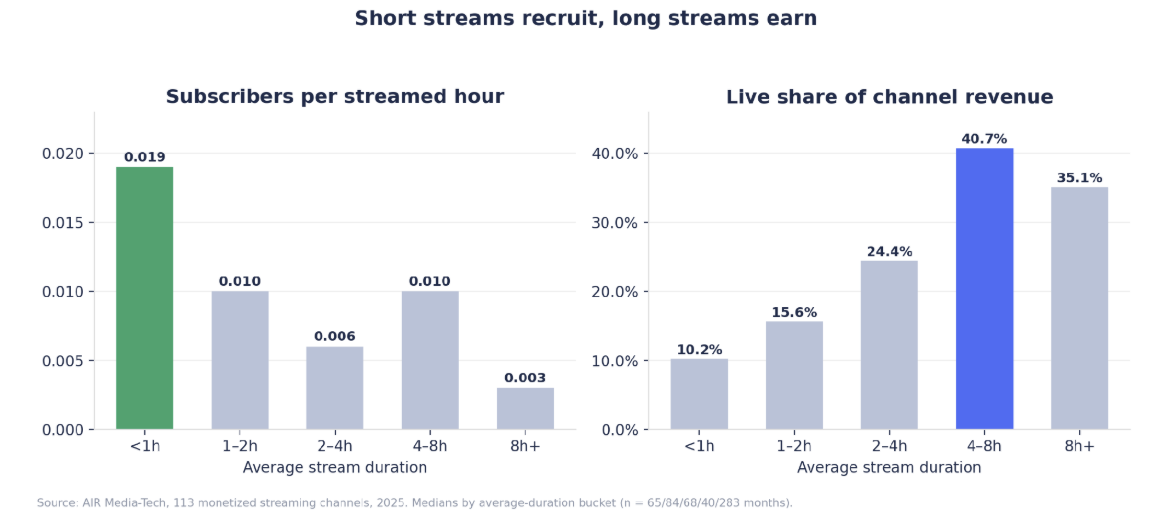
Short streams convert, long streams earn
An hour or less of live time converts viewers to subscribers six times better than a round-the-clock broadcast. But the long formats carry up to 40% of a channel’s ad revenue. Several channels in our sample simply run both: short, promoted live events to grow the audience, plus a continuous background stream to collect watch time and revenue. The two don’t compete – one is a show, the other is a radio station.
When Should You Stream?
A live view in December pays 2.4 times more than a live view in January. Median live RPM starts the year at $2.31, climbs through the summer, and holds near or above $5 from September through December, when holiday advertisers bid up every ad slot on the platform.
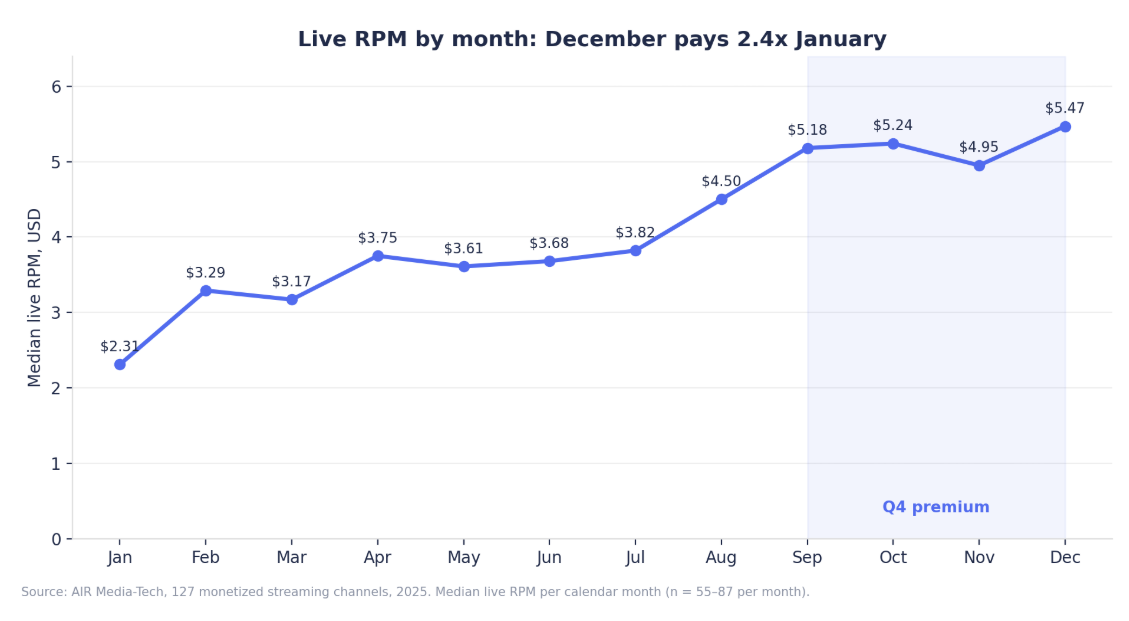
Live RPM by month
|
Month |
Median live RPM |
Month |
Median live RPM |
|
January |
$2.31 |
July |
$3.82 |
|
February |
$3.29 |
August |
$4.50 |
|
March |
$3.17 |
September |
$5.18 |
|
April |
$3.75 |
October |
$5.24 |
|
May |
$3.61 |
November |
$4.95 |
|
June |
$3.68 |
December |
$5.47 |
Median live RPM across all monetized streaming months, 2025.
Don’t judge streaming by a January test – the same stream earns at twice the rate in Q4. And if you already stream, autumn is when to add hours and streams, because each one is worth the most. The platform itself shifts with the calendar too, and streams ride the same waves as uploads.
Q4 is also when themed streams shine. One lounge-music channel built holiday 24/7 broadcasts and carried 79% of its peak-season revenue into the January–March slump – a stretch where music channels routinely lose half.
The 42x Gap Between Dabbling and Committing
Squeeze everything above into one comparison and here’s what’s left.
- Channels that stream occasionally (a few times a month, on and off) earn a median $7.25 a month from live. Live makes up 6.2% of their revenue and 2.4% of their new subscribers. A side note on their channel.
- Channels that committed to streaming earn a median $306.52 a month from live: 42 times more. Live carries 44.9% of their revenue and 31.2% of their subscriber growth. On these channels, streaming is a second business that runs alongside the first.
There’s also a small third group worth a sentence: eight channels that switched from occasional to committed streaming during the year. Mid-transition, they already earned a median $528.15 a month from live while its share of their revenue (11.6%) was still catching up – the money arrives before the mix shifts.
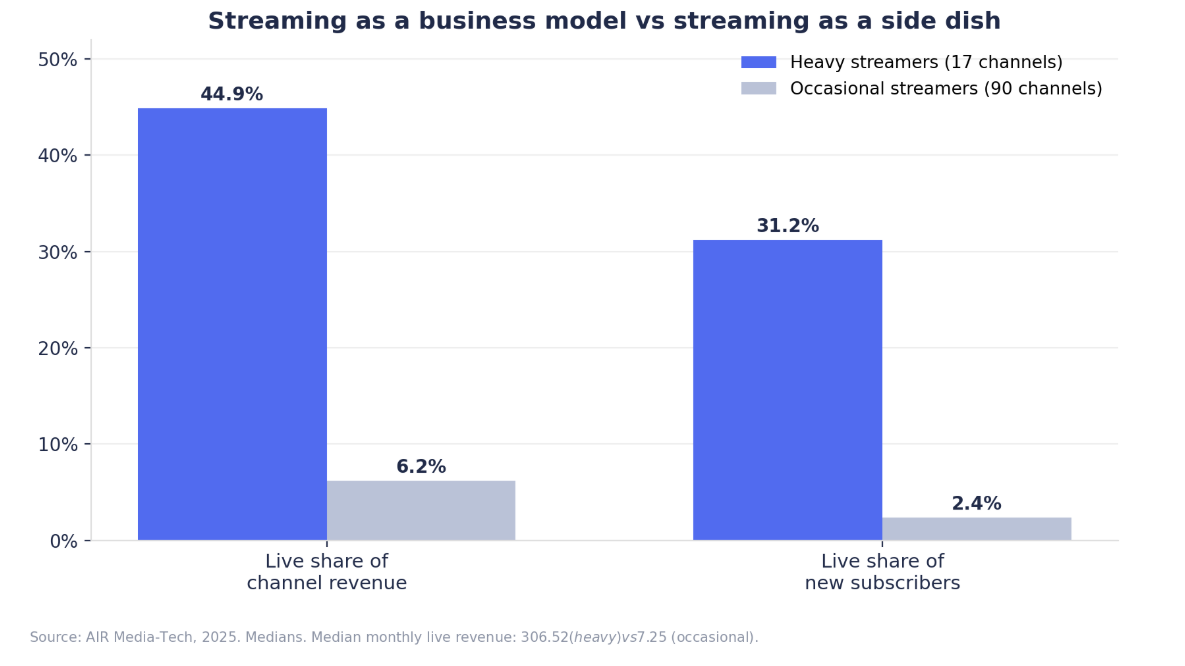
Occasional vs committed streamers
The committed group is where the famous results come from.
- StrEat, a gaming channel with 2.8M subscribers, put four 24/7 streams on its old videos and multiplied its partner income five times – streams now bring 83% of its watch hours and 80% of its yearly revenue.
- Boxing Mates, at 269K subscribers, added four streams and grew channel revenue 65% and watch time 183% in five months.
- DONA English, at 5.2M, took live from 20% to 60% of channel revenue in about six weeks, with total views up 42% along the way.
Notice what none of these channels did: go live in person. They turned catalogs they already owned into broadcasts, kept uploading as usual, and let the second business grow next to the first.
Which Setup Fits Your Goal?
The findings above sort into a short decision table. Match the setup to the goal, not the other way around.
|
If your goal is… |
The setup the data favors |
The number behind it |
|
Revenue from live |
8+ streams a month, long or continuous formats |
Live share of ad revenue climbs from 4.4% at one stream to 50.2% at 8+ |
|
Subscribers per hour of your time |
2–3 promoted event streams a month, under 2 hours each |
Subs per streamed hour peak at moderate frequency and short duration |
|
Maximum total growth |
8+ streams a month |
106 live subscribers a month; 40.3% of all new subs |
|
Watch time for the algorithm |
4–7 streams a month and up, archives kept public |
Streaming months showed ~3x total watch time on music channels and ~7x on lifestyle |
|
Keeping your videos safe |
Any frequency, hold your upload schedule |
The only group whose videos grew (+7.2%) kept raising uploads while streaming |
|
A cheap test of the format |
1–2 streams a month, properly packaged |
Expect roughly 4% revenue share at this tier — a signal, not a verdict |
Three Decisions the Data Settles
Three things to take from 3,893 channel-months of data.
- Streaming pays in proportion to commitment. One stream a month brings 4.4% of revenue; eight or more bring 50.2%, at a higher rate per view, and four in ten of those channels’ new subscribers arrive through live. There is no point on that curve where adding streams hurts. If you’re going to test the format, test it properly – a single stream tells you little to nothing.
- Your videos are safer than you think. Every scary “streaming months” number in our data traces back to seasonality or slashed upload schedules. The channels that streamed on top of their normal uploads saw videos hold or grow. Stream in addition to your content, never instead of it.
- Match the format to the goal. Short promoted streams for subscribers. Long or continuous streams for revenue and watch time. Autumn for both, because Q4 pays live views twice as well as January does.
We go further into each niche here, to learn how it streams, what the money looks like at every channel size, and what real channels earned when they went all in.
The One Channel This Study Didn't Measure
Every figure above is a median across 404 channels. Yours will land somewhere else – above the middle or below it, pulled by your catalog, your audience's regions, your niche's ad rates, and the state of your uploads.
Finding that spot is audit work. Streaming strategy is one of the ten areas AIR's specialists go through, with more than 3,000 audited channels behind the method. Every audit ends with:
- a structured report
- A 30-day action plan ranked by impact
- and a 45–60-minute live walkthrough with a senior strategist.