


YouTube pays a median of about $2,300 per million long-form views in 2026. We measured that across 300 AIR-managed channels and 3,595 monetized channel-months of Studio data, from May 2025 to May 2026. Most guides quote $3,000-$5,000 because they start from advertiser CPM, the rate before YouTube takes its 45% and before unmonetized views drop out.
The median hides a wide range. Inside Education & Science alone, the top quarter of channels earns 8.4× more per view than the bottom quarter. Where your channel lands depends on three things: your niche, the countries your audience watches from, and how many of your views show an ad. The calculator below gives you your own number.
How Much Will Your Million Views Pay?
Pick your niche in this YouTube Earnings Calculator and enter your long-form views. Add your RPM from Studio → Analytics → Revenue, and the calculator also tells you whether you sit below, inside, or above the typical range for your niche.
*This calculator covers long-form views only. Shorts earn 3–14% as much per view, so count them separately.*
If you leave the RPM field blank, the figure is your niche's median. Two things decide whether your channel lands above or below it.
- Where your audience watches from. A mostly U.S., U.K., Australian, or Nordic audience pulls you toward the top of your niche's range.
- How many of your views show an ad. The median channel monetizes 53% of its views, so if yours is lower, expect less than the median.
Both are covered in detail below.
How Much Does Each YouTube Niche Pay Per Million Views?
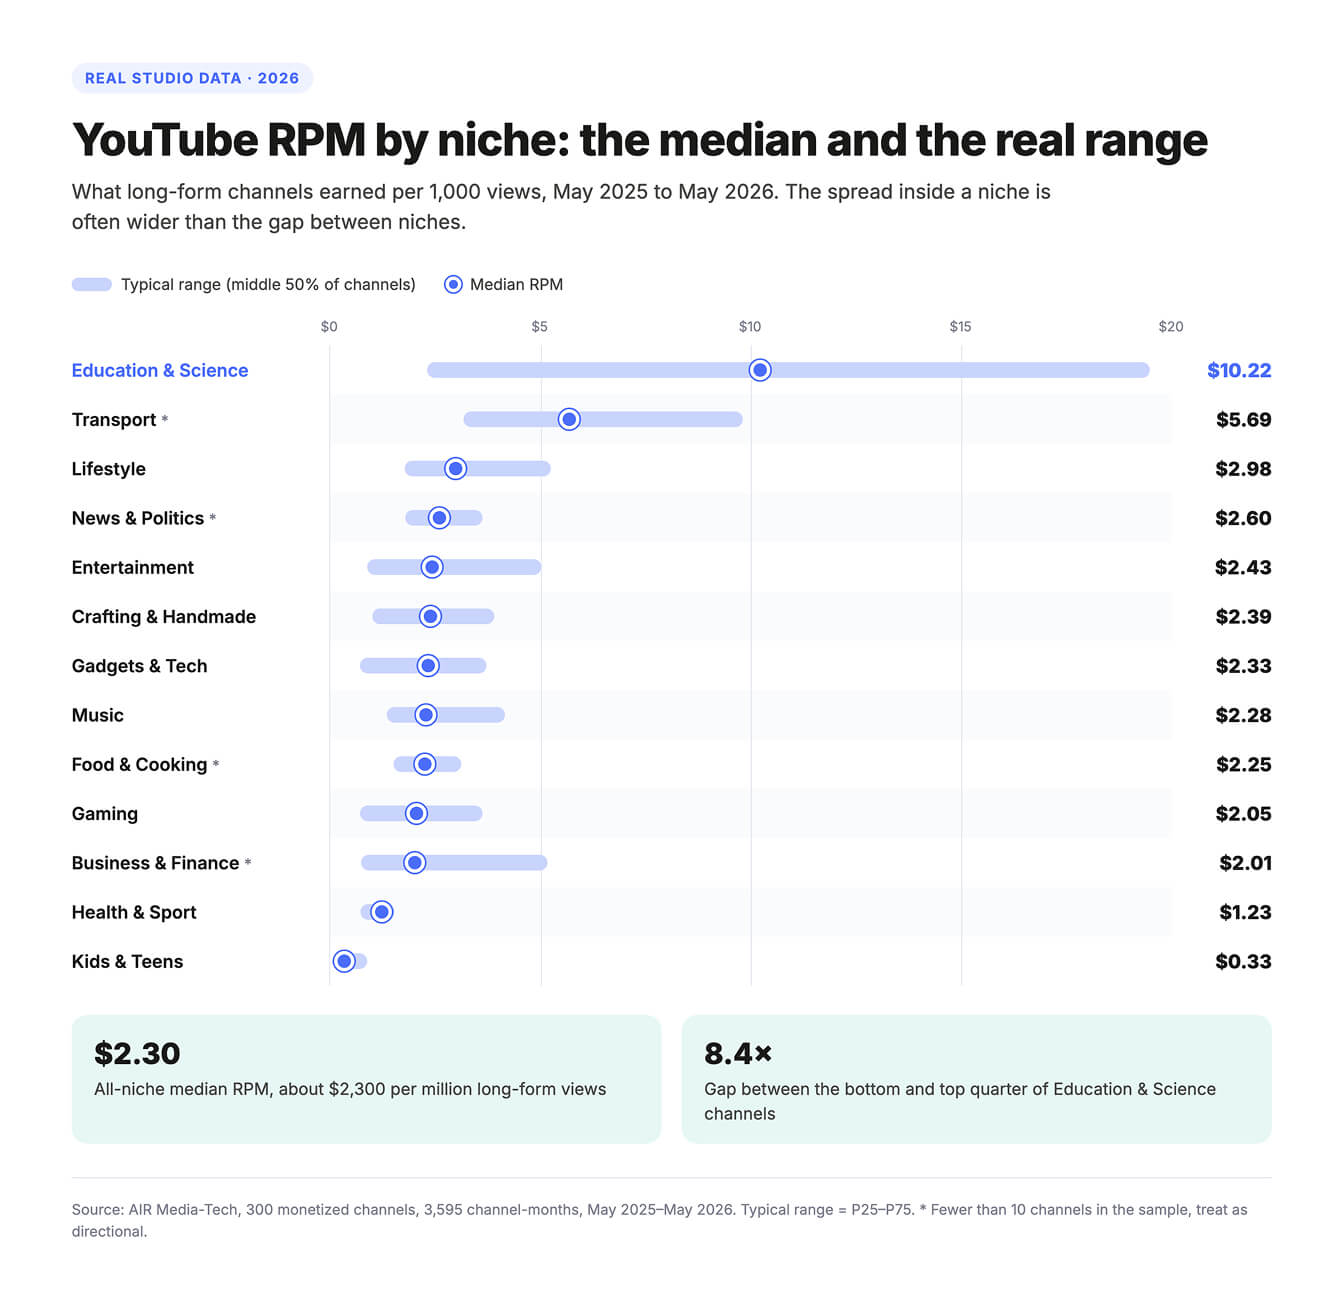
Education & Science pays the most per view in 2026, at a $10.22 median RPM — more than four times the all-niche median and roughly thirty times what Kids & Teens content earns. Below the top two niches, the gap tightens fast: most niches sit within a dollar or two of each other, and the spread inside a single niche is usually wider than the distance between niches.
This is the real 13-niche ranking, measured from 300 AIR-managed channels’ actual Studio data — not advertiser CPM estimates:
|
Niche |
Median RPM |
Typical range (P25–P75) |
Earnings per 1M views |
|---|---|---|---|
|
Education & Science |
$10.22 |
$2.31 – $19.50 |
~$10,220 |
|
Transport* |
$5.69 |
$3.17 – $9.81 |
~$5,690 |
|
Lifestyle |
$2.98 |
$1.77 – $5.24 |
~$2,980 |
|
News & Politics* |
$2.60 |
$1.79 – $3.62 |
~$2,600 |
|
Entertainment |
$2.43 |
$0.88 – $5.02 |
~$2,430 |
|
Crafting & Handmade |
$2.39 |
$1.00 – $3.90 |
~$2,390 |
|
Gadgets & Tech |
$2.33 |
$0.70 – $3.71 |
~$2,330 |
|
Music |
$2.28 |
$1.35 – $4.16 |
~$2,280 |
|
Food & Cooking* |
$2.25 |
$1.50 – $3.11 |
~$2,250 |
|
Gaming |
$2.05 |
$0.70 – $3.62 |
~$2,050 |
|
Business & Finance* |
$2.01 |
$0.73 – $5.17 |
~$2,010 |
|
Health & Sport |
$1.23 |
$0.72 – $1.53 |
~$1,230 |
|
Kids & Teens |
$0.33 |
$0.16 – $0.88 |
~$330 |
Source: AIR Media-Tech, 300 monetized channels, 3,595 channel-months, May 2025–May 2026. Niches marked with an asterisk had fewer than 10 channels in the sample — treat as directional. Full niche CPM breakdown.
Finance sits near the middle of the table, far from the top spot most guides give it. Popular estimates put finance RPM at $10-45, while the Business & Finance median across AIR's sample came in at $2.01, with the top quarter of channels at $5.17. The sample is small (under 10 channels), so treat it as directional, but the gap between the popular claim and what these channels earned in Studio is wide.
Niche Sets the Floor, Not the Ceiling
Inside Education & Science, the bottom quarter of channels earns $2.31 RPM and the top quarter earns $19.50 — an 8.4× spread inside one niche, wider than the gap between most niches on the table above. A poorly run channel in a “good” niche can easily out-earn a well-run channel in a “worse” one.
- Kids & Teens sits at the bottom of the table, and per-view revenue still moves inside it. Azooz & Jude, a 265K-subscriber kids channel, grew views 50.76% and revenue 140% in one quarter of 2025, so each view earned roughly 59% more. The channel switched to a steady upload schedule, moved to 4K, and reworked its metadata.
- Another one of our kids channels was publishing 2–3 minute videos, some duplicated across two versions of the same footage. Switching to 10-minute compilations of the same content lifted average view duration 19%, CPM 9%, and RPM 72%. Nothing else changed.
How Many Views Do You Need to Make $1,000, $2,000, or $10,000 a Month?
Divide your monthly target by your RPM and multiply by 1,000. At the 2026 all-niche median of $2.30, $2,000 a month takes about 870,000 long-form views. The same target takes under 200,000 views in Education & Science and over 6 million in Kids & Teens.
|
Monthly target |
All-niche median ($2.30 RPM) |
Education & Science ($10.22) |
Gaming ($2.05) |
Kids & Teens ($0.33) |
|
$1,000 |
~435,000 views |
~98,000 views |
~488,000 views |
~3.0M views |
|
$2,000 |
~870,000 views |
~196,000 views |
~976,000 views |
~6.1M views |
|
$3,000 |
~1.3M views |
~294,000 views |
~1.46M views |
~9.1M views |
|
$10,000 |
~4.35M views |
~979,000 views |
~4.9M views |
~30M views |
Long-form views at niche median RPM, AIR Media-Tech, 300 channels, 3,595 channel-months, May 2025–May 2026. Shorts views earn 3–14% as much per view.
What Are CPM and RPM, and How Do They Turn Into a Payout?
CPM is what advertisers pay YouTube per 1,000 ad impressions. RPM is what a creator receives per 1,000 views, after YouTube keeps 45% of ad revenue. The two numbers get confused constantly, and that confusion is why so many "how much does YouTube pay" estimates run high: they quote CPM where they should quote RPM.
A channel with a $2.30 RPM (the 2026 all-niche median) earns roughly $2,300 per million views. A channel with a $10 RPM earns $10,000 for the same million views. The traffic is identical, and the gap comes from what each audience is worth to advertisers.
Three more reasons your own RPM won’t match a “headline” CPM figure you see quoted:
- “CPM” is a blend of very different ad formats. Skippable TrueView ads, 6-second bumper ads, display, and overlay formats each carry a different rate, and the CPM your channel earns is a weighted mix of whichever formats are served.
- Not every view carries ad revenue at all. Viewers with AdBlock installed generate nothing. Viewers on YouTube Premium generate revenue too, but from a separate subscription pool split by watch-time share.
- The view counter and the paid views are different numbers. Since August 24, 2026, YouTube counts a view the moment a video starts playing, in every format. Earnings still come from engaged views and engaged watch hours, so your public view count can run ahead of the views that pay.
YouTube has also announced that from February 1, 2027, Premium Lite will expand to every country where Premium is sold, and 60% of its net revenue will fund the creator pool, against 30% for regular Premium.
Why Don't Earnings Calculators Like Social Blade Match Your Studio?
Social Blade estimates earnings with a flat RPM range of $0.25-$4.00 for every channel, which works out to 250–4,000 per million views. That range is too wide to tell you where your own channel sits, and it assumes every view carries an ad. In AIR's 300-channel study, the median channel monetized only 53% of its views. Social Blade also can't see your Shorts-to-long-form mix or the countries your audience watches from, which is why the RPM figures in this article come from Studio data across 300 AIR-managed channels instead.
Big view counts, small paycheck?
Views and revenue don't move together by default. Our specialists can show you where the disconnect hides and how to fix it.
Show me what to fixDoes Country Change What 1 Million Views Are Worth?
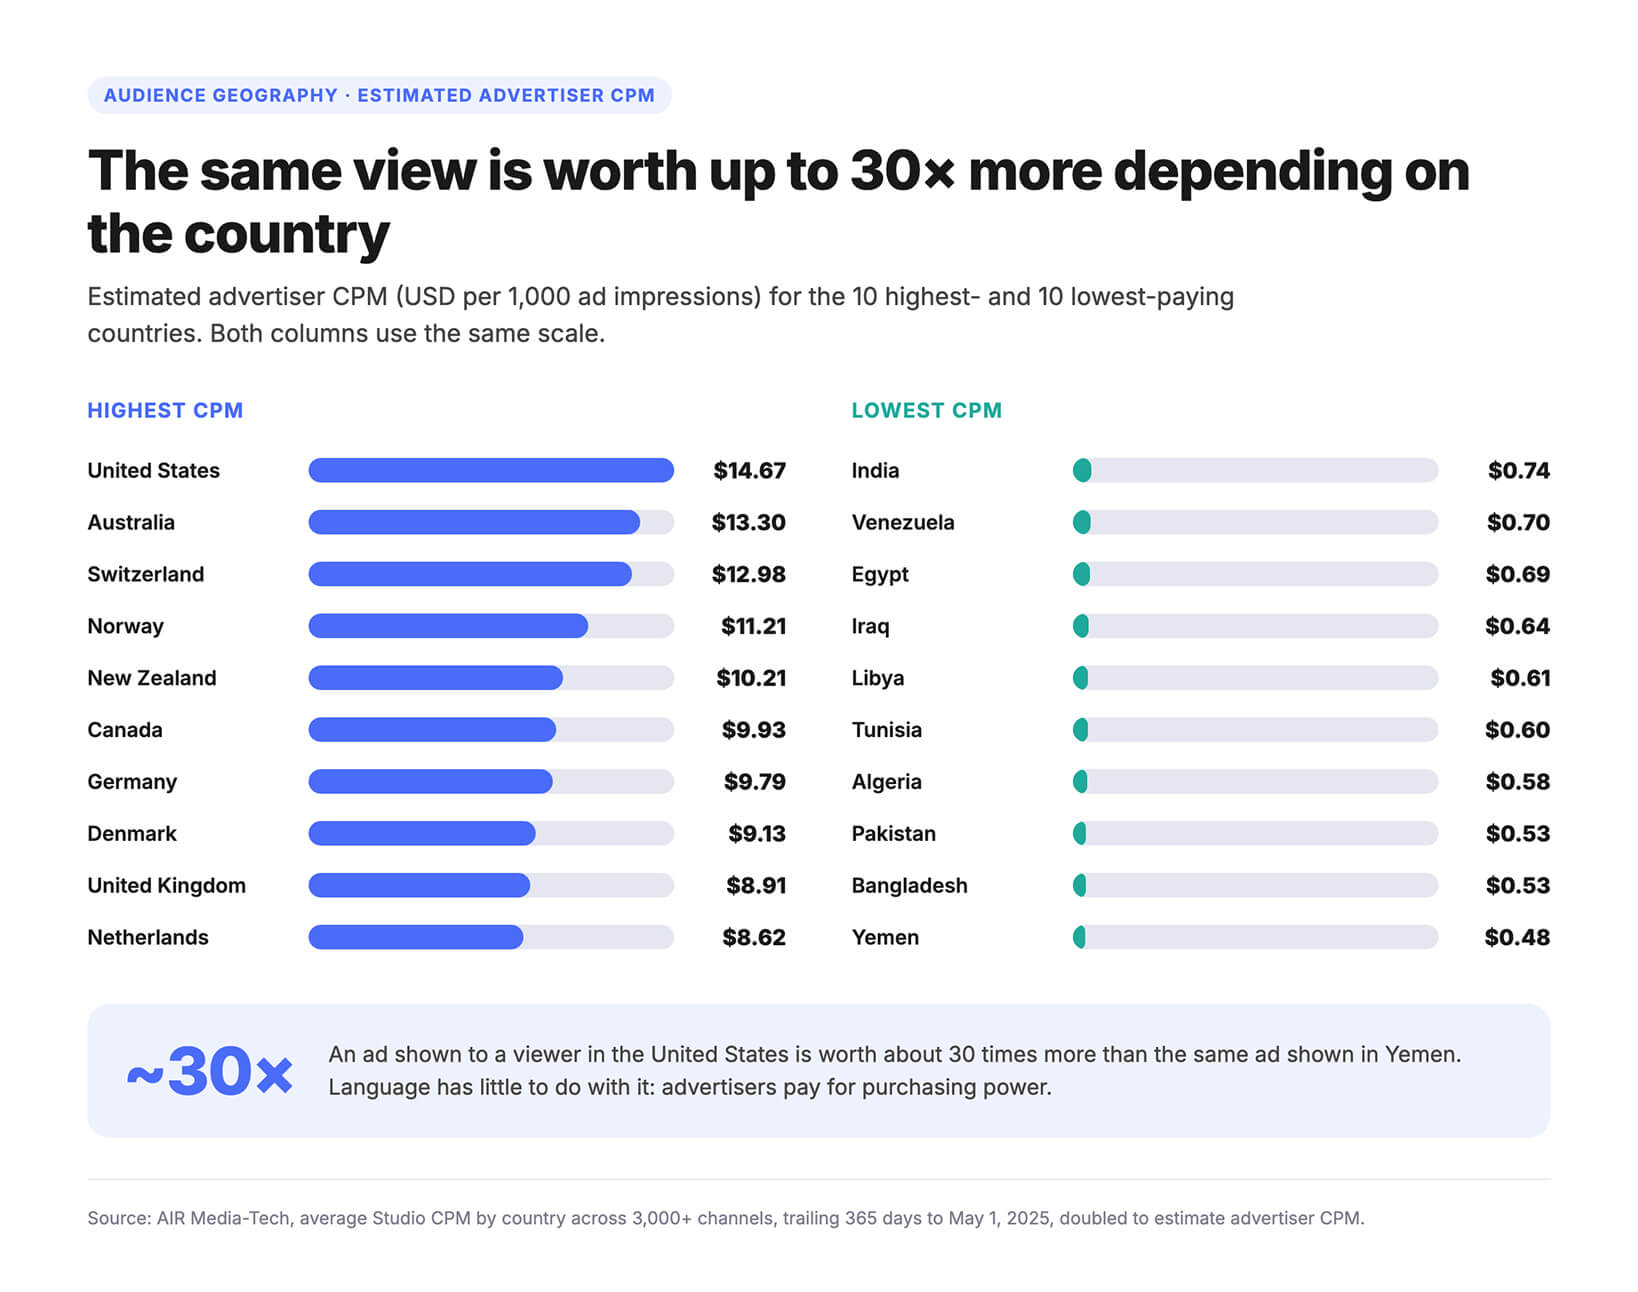
Audience geography alone can move CPM by up to 30× between the highest- and lowest-paying countries, because advertisers pay for purchasing power, not language.
|
Highest-CPM countries |
CPM (USD/1,000) |
Lowest-CPM countries |
CPM (USD/1,000) |
|
United States |
$14.67 |
India |
$0.74 |
|
Australia |
$13.30 |
Venezuela |
$0.70 |
|
Switzerland |
$12.98 |
Egypt |
$0.69 |
|
Norway |
$11.21 |
Iraq |
$0.64 |
|
New Zealand |
$10.21 |
Libya |
$0.61 |
|
Canada |
$9.93 |
Tunisia |
$0.60 |
|
Germany |
$9.79 |
Algeria |
$0.58 |
|
Denmark |
$9.13 |
Pakistan |
$0.53 |
|
United Kingdom |
$8.91 |
Bangladesh |
$0.53 |
|
Netherlands |
$8.62 |
Yemen |
$0.48 |
Source: AIR Media-Tech, CPM data from 3,000+ channels, published June 2025.
An English-language channel is not the same thing as a U.S. audience. Nigeria, the Philippines, and Pakistan all publish primarily in English, yet their estimated advertiser CPM runs about $0.50-$1.70, against $9-$15 for U.S. or U.K. audiences. A channel can be 100% English and still land far down the table above if its viewers mostly watch from lower-spend regions. Check Studio → Audience → Geography to see your own blend.
Revenue swings with the season. Across AIR's 300-channel RPM study, median RPM peaked in November at $2.35 and fell to $1.56 in January, about 34% lower, once holiday ad budgets ran out. That's why the "best month" screenshots creators share tend to run high.
The full month-by-month table and the Q4 lift for every niche are in our 2026 YouTube monetization report.
What Else Changes What 1 Million Views Are Worth
Viewer engagement drives most of what's left.
YouTube ranks and distributes videos by satisfaction signals (watch time, audience retention, likes, and comments), and the same signals decide how much ad inventory a video can carry, so engagement and RPM tend to move together.
Retention drives ad density. When a viewer watches 80% of a 15-minute video, YouTube reads that as a strong match between the content and the viewer’s intent and continues recommending the video to similar viewers; when viewers exit at 20%, distribution pulls back. Watch time also has a direct revenue mechanism: more watch time means more mid-roll slots can trigger and more monetized playbacks per session — the same lever behind the ad-placement numbers below.
Engagement rate is a second signal. Measured as (likes + comments) ÷ views, it tells YouTube whether a video generated enough of a reaction to justify further distribution. Neither signal alone explains performance — a video can hold retention without generating comments, or vice versa — but channels in the top-performing segment of their niche consistently show a distinct pattern on both.
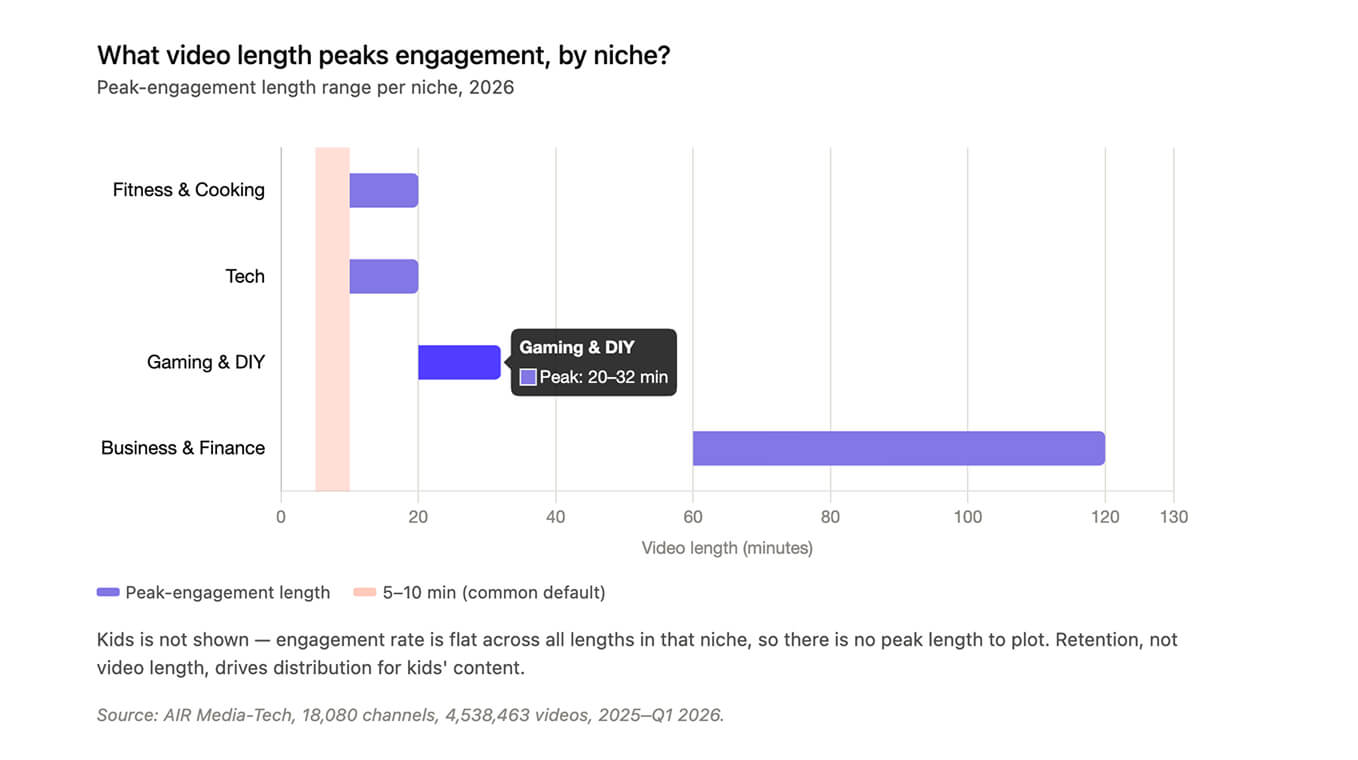
The signal that moves both is length, and it’s niche-specific. Across 4,538,463 videos and 18,080 channels, the ideal YouTube video length by niche study found:
|
Niche |
Peak length |
Engagement signal |
|---|---|---|
|
Gaming & DIY |
20–30 minutes (and up) |
Longest formats hold strongest engagement at every size tier |
|
Business & Finance |
1–2 hours |
10.79% engagement — the highest in the study |
|
Fitness & Cooking |
10–20 minutes |
Meaningful gains over sub-10-minute formats at every tier |
|
Tech |
10–20 minutes |
Gap vs. 5–10 minutes widens at larger channel sizes |
|
Kids |
Flat across all lengths |
Retention, not engagement rate, drives distribution here |
Source: AIR Media-Tech, 18,080 channels, 4,538,463 videos, 2025–Q1 2026. Full study.
The 5–10 minute range is where most creators default, and across every niche in the study, it's where engagement is weakest. The link is correlational, since execution, topic, and packaging all contribute, but it held too consistently across 4.5 million videos to treat length as a minor variable.
Length can move revenue even when views fall. A DIY channel AIR works with stretched its videos from 20–25 minutes to 25–30+ and grew revenue 20% while views dropped 9%. Watch time rose 7.6%, and CPM rose about 10% with the end-of-year season, so the rest of the gain came from longer sessions carrying more ads.
Why are other channels in your niche pulling ahead?
They found something you haven't yet. We've seen it across 3,000+ channels — we'll show you exactly what it is and how to close the gap. → Run the channel audit.
How Much Do Long-Form, Shorts, and Live Streams Each Pay for 1 Million Views?
Long-form pays the most per view, Shorts pay a fraction of that, and streams beat long-form RPM in about half of niches, but none of these numbers mean much without the context of how each format behaves at scale.
|
Format |
Typical RPM (2026) |
What drives revenue |
|---|---|---|
|
Long-form |
Niche median, $0.33–$10.22 |
Ad inventory density, watch time, niche |
|
Shorts |
3–14% of long-form RPM |
Volume + Shorts-to-long conversion, not direct RPM |
|
Live streams |
Beats long-form in 5/10 niche-size segments |
Streaming frequency (8+/per month is optimal), not single-stream view count |
*Sources: AIR Media-Tech Shorts study (274 channels), livestream study (404 channels), and niche RPM study (300 channels), 2025–2026.
Long-Form: The RPM Baseline
Long-form is where the ad inventory is richest — pre-roll, mid-roll, and post-roll all apply, and it’s the format the niche table above measures. RPM also hides a second number: the share of views that serve an ad at all. Across the 300-channel RPM study, the median channel monetized just 53% of its views — the rest generated nothing, regardless of niche or RPM.
|
Niche |
Views that show an ad |
|---|---|
|
Education & Science |
77% |
|
Transport* |
62% |
|
Lifestyle |
61% |
|
Gaming |
55% |
|
Gadgets & Tech |
34% |
|
Kids & Teens |
32% |
Source: AIR Media-Tech, 300 channels, 3,595 channel-months. Full breakdown by niche.
Gadgets & Tech posts a healthy $5.73 median Studio CPM and still lands a $2.33 RPM, because only a third of its views ever reach an advertiser. This is why two channels with the same CPM can post very different RPM — the monetized-playback rate is the multiplier most creators never check.
Shorts: A Fraction of Long-Form RPM, by Design
Shorts monetize through a separate ad model with a much lower RPM than long-form, and publishing them pulls down a channel’s blended CPM — which is why every figure in this article separates RPM_LONG from RPM_SHORTS instead of quoting one blended number. A channel that looks like it “dropped” in overall CPM after adding Shorts often didn’t get worse at monetizing either format; it just changed its mix. Always check the two separately before diagnosing a problem.
Shorts RPM runs 3–14% of long-form RPM in almost every niche, measured across the 274-channel Shorts study. That means most channels need roughly 7,000–33,000 Shorts views to earn what 1,000 long-form views generate. Music is the lone exception, where Content ID narrows the gap to 41–60% because Shorts using licensed music share in that revenue.
|
Country |
Shorts RPM (per 1,000 views) |
|---|---|
|
United States |
$0.328 |
|
Australia |
$0.193 |
|
United Kingdom |
$0.166 |
|
Canada |
$0.165 |
Source: AIR Media-Tech, 274 channels, verified partner data. A million Shorts views from a U.S.-heavy audience lands around $300 in direct revenue, and that's the ceiling for most channels.
From February 1, 2027, a channel with 1 million Shorts views a quarter will earn nothing from Shorts ads. YouTube has announced that channels will need 10 million qualified Shorts views over the trailing 90 days to share in Shorts ad revenue. Below that line, Shorts payouts pause until the channel crosses 10 million again, while long-form monetization and YPP status stay in place. Qualified views count only public Shorts watched past the first few seconds, with loops excluded. We broke down every part of the update in YouTube's new monetization rules.
For most channels, direct Shorts revenue is the smaller question.
Direct Shorts revenue makes up under 2% of total revenue for most channels, while consuming a much larger share of production time and total views. The right question is what Shorts do to the rest of the channel: they bring in viewers, and long-form converts them into revenue.
The same 274-channel study found a 0.28–0.40 Shorts-to-long-form ratio — roughly 1 Short per 2–3 long-form uploads — produces the best subscriber and revenue outcomes. Heavy Shorts pivots show the opposite: Entertainment channels posting 21+ Shorts a month saw RPM fall from $4.99 to $1.15, a 77% decline, in a within-channel comparison. Gaming is the exception — RPM barely moves whether or not Gaming channels post Shorts, because Gaming audiences don’t substitute Shorts for long-form the way Entertainment audiences do.
Live Streams: RPM Scales With Frequency, Not View Count
Live streams beat long-form RPM outright in 5 of 10 niche-size segments measured across the 404-channel livestream study — Kids & Teens large channels earn 3.1× more per stream view than per video view, and Entertainment small channels earn 3.0× more. But “1 million views on a stream” isn’t a typical outcome to plan around: the median monetized stream draws 45 views, and only the top 5% cross roughly 3,200. What predicts stream revenue is frequency:
|
Streams per month |
Live share of ad revenue |
Live RPM |
Video RPM (same channels) |
|---|---|---|---|
|
1 |
4.4% |
$2.68 |
$2.22 |
|
2–3 |
16.5% |
$4.23 |
$2.35 |
|
4–7 |
28.8% |
$3.12 |
$2.17 |
|
8+ |
50.2% |
$5.67 |
$4.59 |
*Source: AIR Media-Tech, 1,287 channel-months from the 127 channels in the 404-channel sample that streamed and monetized live content, 2025–Q1 2026. Full livestream study.
At every frequency tier, live RPM matches or beats video RPM on the same channels — even one stream a month edges out video RPM slightly. The format starts paying once streaming becomes a habit.
Each format does a different job:
- Shorts for discovery
- Long-form for revenue
- Streams for both algorithmic presence and, at high frequency, real ad income.
The same view count can produce very different payouts depending on streaming format and stream orientation.
- One AIR partner tested vertical live streams against their usual horizontal format. Vertical streams pulled fewer total views, less watch time, and lower retention — yet earned slightly more revenue, purely because RPM ran higher on vertical inventory. Shorts and long-form views on the same channel also rose during the vertical-stream window, a cross-format lift beyond the stream revenue itself.
- Boxing Mates, a 269K-subscriber entertainment channel, launched four simultaneous 24/7 streams from its back catalog. Monthly revenue rose 65% against a 40.5% rise in views, so each view earned about 17% more, and by February streams brought in 55% of the channel's revenue. Average view duration on the streams reached 11:10, against 3:01 on regular uploads.
How Does Ad Placement Change What You Earn Per Million Views?
Ad placement alone can shift earnings per million views by thousands of dollars with no change in traffic. YouTube allows mid-roll ads on videos over 8 minutes, and a single automatic mid-roll earns less than 2–3 mid-rolls placed at retention peaks. The example below shows the size of that gap for a channel starting at a $4.50 RPM.
Illustrative example for a channel at a $4.50 RPM, not a measured median.
|
Setup |
Ads |
RPM |
Earnings per 1M views |
|---|---|---|---|
|
Under-optimized |
1 pre-roll + 1 automatic mid-roll |
$4.50 |
$4,500 |
|
Structured mid-roll strategy |
1 pre-roll + 2–3 manually placed mid-rolls |
$6.00–$7.00 |
$6,000–$7,000 |
That’s a $1,500–$2,500 difference per million views with no additional audience. The mechanics: avoid placing ads immediately after viewer drop-off points, insert mid-rolls before natural topic transitions, and use retention graphs to find stable watch segments before adding density.
YouTube’s own guidance on managing mid-roll ad breaks confirms the same principle from the platform side — ad slots placed at natural breakpoints are more likely to serve an ad, while slots dropped mid-sentence or mid-action are flagged as unlikely to serve. YouTube has also said that combining automatic and manual mid-roll placement produces an average 5% revenue increase over manual placement alone, based on its own internal testing.
Doing this by hand means reading the retention graph of every video and re-testing placement over time. AIR's Ads Boost places mid-roll breaks on past and new uploads automatically.
How to Get Paid More Per View on YouTube in 2026?
Most of what raises RPM comes from mechanics you control without a single extra view: how many of your views serve an ad, how many ads each one carries, how your content is paced, and whether your format mix matches what pays.
|
# |
Lever |
Check this |
Try this |
|
1 |
Monetized-playback rate |
Studio → Analytics → Revenue: % of views that show an ad (median is 53%) |
If it's low, enable pre-roll and post-roll ads on any videos missing them, and get your videos past 8 minutes so mid-rolls can run too |
|
2 |
Ad settings on old videos |
Bulk-check ad settings on your last 20–30 videos |
Bulk-enable pre-roll and post-roll for all of them — Google treats this as the safe default. Don't bulk-enable mid-roll the same way — place it manually at retention peaks, or use Ads Boost, which is built to place it without hurting viewer experience |
|
3 |
Video length |
Your average length lately |
Cross 8 minutes with your content — mid-rolls only unlock past that point, and the gap is $4,500 vs. $6,000–$7,000 per million views |
|
4 |
Ad load per video |
Ads per monetized view vs. your niche |
Build in a natural pause every 3–4 minutes — more break points, more mid-rolls can trigger |
|
5 |
Video length vs. your niche |
Your typical length vs. your niche's engagement peak |
Try one video at your niche's peak length, compare RPM to your last 5 |
|
6 |
Retention |
Your average % viewed vs. ~50% |
If it's low, the fix usually isn't cutting the video shorter — it's structure. Five tested ways to raise retention: shoot for TV (1080p/4K, 15–60 min), use premieres, build playlists that chain your videos together, and consider a live component. One AIR partner saw a 52% revenue lift just from optimizing for TV viewing |
|
7 |
Shorts ratio |
% of uploads that are Shorts |
Aim for 1 Short per 2–3 long-form videos — outside that range, RPM tends to drop |
|
8 |
Streaming frequency |
Streams per month |
Commit to a streaming schedule for a full quarter, or run 24/7 streams — one test stream won't show what the format can do |
|
9 |
Stream orientation |
Have you only tried horizontal? |
Test vertical for a couple of streams and compare |
|
10 |
Audience geography |
Studio → Audience → Geography vs. the country CPM table |
If your growth is in low-CPM English-speaking markets, localize your top videos into higher-CPM languages with AIR Translation Labs |
|
11 |
Upload volume |
Videos posted in the last 12 months |
Optimal frequency is niche-specific. Gaming and kids' content peak at 20–40 videos/month, and most other niches peak much lower, around 2–10/month. Full frequency breakdown by niche. Posting above your niche's benchmark hurts more than posting below it — over-posting channels averaged 55% fewer subscribers than channels at the optimal rate. A consistent schedule at the right frequency beats a heavier, erratic one |
|
12 |
Old video drag |
Sort Studio → Content by CTR ascending — anything under 0.5% CTR and over 12 months old is a candidate |
Don't unlist first. Refresh title, thumbnail, and description on those videos and give it 60–90 days. Only unlist (never delete) if it still shows under 0.5% CTR, under 35% average view duration, and no search traffic after the refresh — and never do it in bulk |
|
13 |
Revenue mix |
Ad revenue as % of total income |
Add one non-ad income source this quarter — membership, sponsor, or affiliate |
Want to earn more per view?
An AIR channel audit finds every gap between your views and your revenue: niche position, audience countries, monetized-playback rate, ad load, and format mix. Then it gives you a plan to close each gap, so the views you already get bring in more money. Our specialists run it on your Studio data, backed by 16 years of managing 3,000+ channels.
What you get:
- A structured report across 10 blocks, from packaging and retention to revenue and channel risks
- A prioritized action plan of 5–8 steps in 3 waves, ranked by impact
- A 45-minute live walkthrough with the senior specialist who wrote your report
The Free and Full Channel Audit tiers run on our AI agents, without the live call.
Close my revenue gaps